CE-351
Microcontrollers, 2022 Spring
Anomaly detection
Name: Mychael Garcia
Email: mhgarcia@fortlewis.edu
Materials:
Project
description
In this project,
I was tasked with following a tutorial that was done by someone on YouTube for
the Digikey channel.
This project was a demonstration in basic machine learning and anomalies
detection. We world attach an ESP-32 connected to an MPU 6050 (accelerometer
and gyroscope) on a moving part. For the tutorial I was following he used a
fan. Turning the fan on we would get acceleration data for all three axis (x,
y, z) and could group them into same simple min and max limits. The second test
would be to put a small weight on the end of one of the fan blades, with this
change we hope to see a small fluctuation in the acceleration in each
direction.
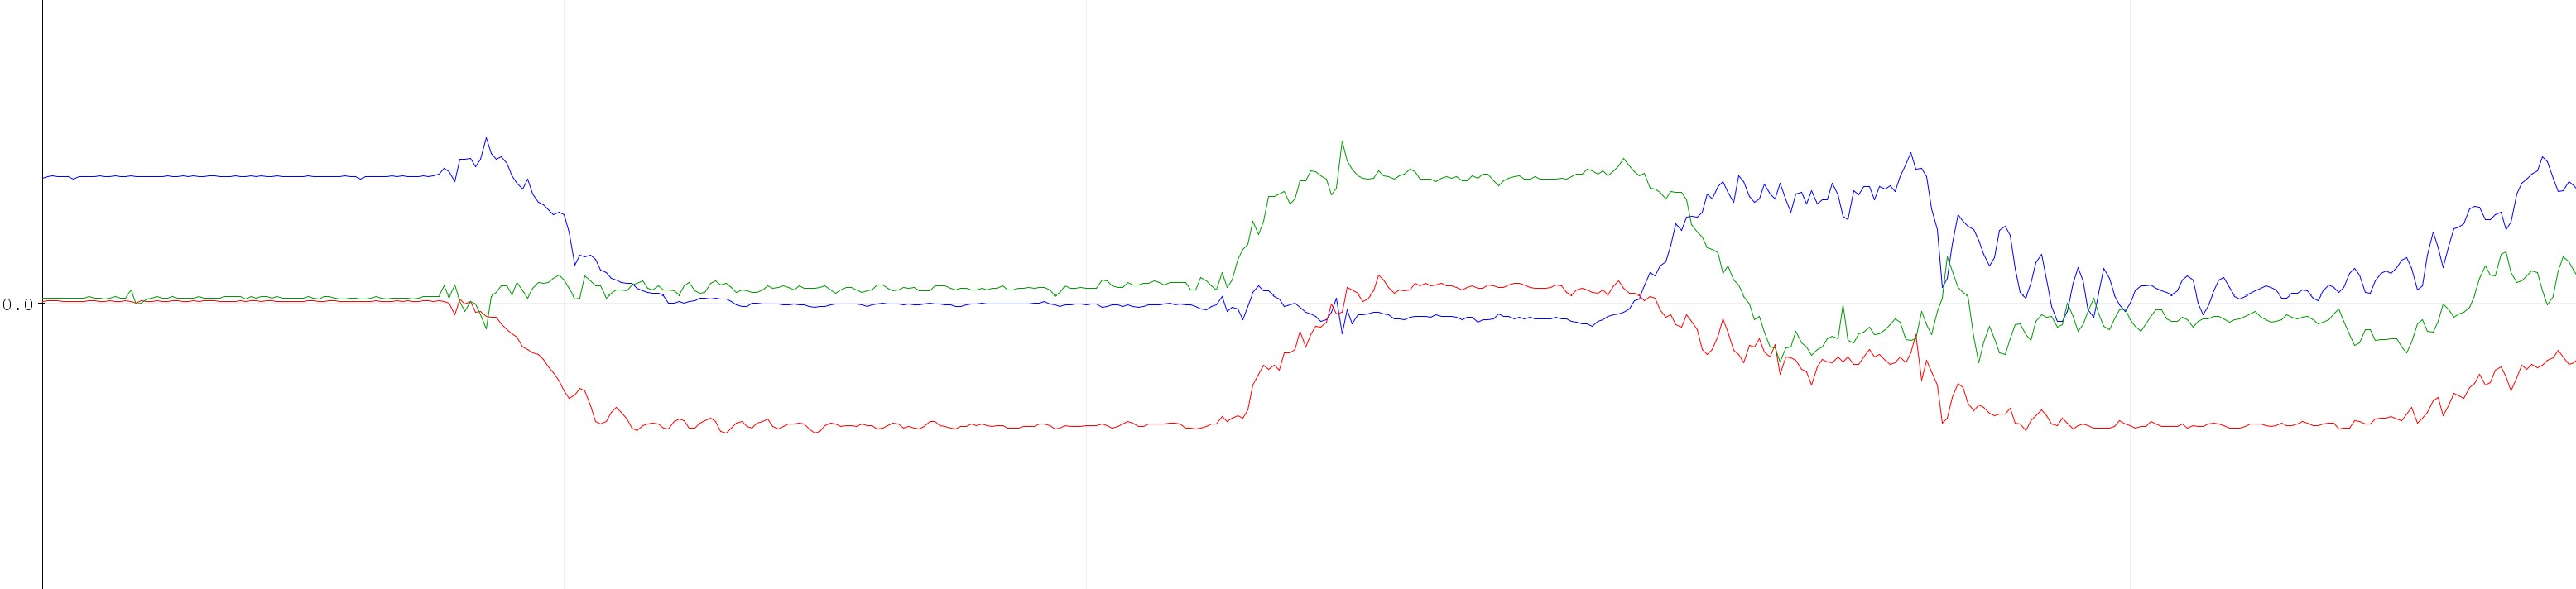
Task 1:
The first task we wanted to get readings from the MPU and see the relative
accelerations compared to gravity. The graph shown is the acceleration data for
each axis (red, blue, green) and the corelating G’s (9.81m/s = 1 G).
Task 2:
After we knew the MPU was working we wanted to collect this data remotely using
our computer. This was done by creating a simple python server that would take
200 measurements and create .CSV files. This was the hardest step as I could
not get the server running following the tutorial, I needed to contact the
writer and see if he had any suggestion on what to do. When running the server,
I was able to get confirmation by this output printed in the terminal window. I
had to change the current path the window was directed at using the command
"cd C:\Users\..." this is directed at the folder where I have my file
saved. I then had to pass in the current info to run the server using the command
“python py_server.py -d test1 -p 1337 -t 100" this would use python to run
my file and save the data in a folder called "test1". The port I was
using was "1337" and it would run for "100" seconds and
then shut down. Additionally, I had to create a simple file that tells me
what my computers Ip address is, so the ESP knows where to direct the data
files.

The is the data we get when running the server and it will give us some relevant information, so we know when we receive a transmission and what title were are giving to the saved data.

Task 3:
If I had more time, I would done some data analysis to find which data grouping
method would be ideal and how we could generate a machine learning model to
produce some sample data and compare it to what our real collected data is. If
we are satisfied that our model is able to detect anomaly, we can upload this
new “filter/maximum value” to the ESP and reattach it to our test object.
Conclusion:
Overall this was a very useful and interesting project.
----------------------------------------------------------------------------------------------------
END