CE351 2020 Fall Lab 5: PID Control - Photocell
Sophie Turner
sjturner@fortlewis.edu
PID Control - Photocell 1.
Introduction
The purpose of this lab was to use a proportional-integral-derivative
controller (PID controller) to stabilize the light detecting resistor (LDR)
system. An Arduino Uno and photocell were used to sense light intensity. The
PID feedback system was used to calculate the error for the data to oscillate
around a set point.
2. Materials and Methods
A photocell also known as a light detecting resistor (LDR) was used to sense
light intensity. The light intensity was graphed on the Arduino serial plotter
as well as plotting in Python. Two LEDs, a push button, and a photocell was
used for this lab. For more detailed methods section go to
http://www.yilectronics.com/Tutorials/Arduino_Basics/Tutorial_5_PID_Photocell/PIDPhotocell.html
3. Results
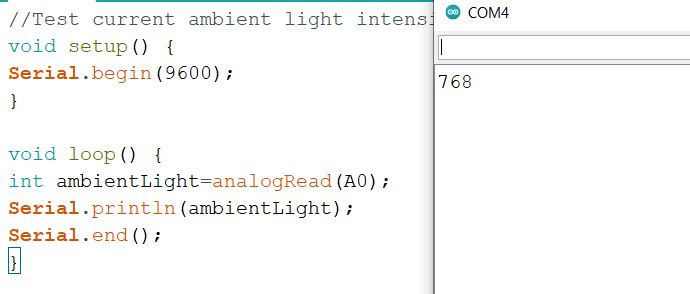
The ambient light was tested to see the lowest value the photocell can detect.
Figure
1. Checking the ambient
light.
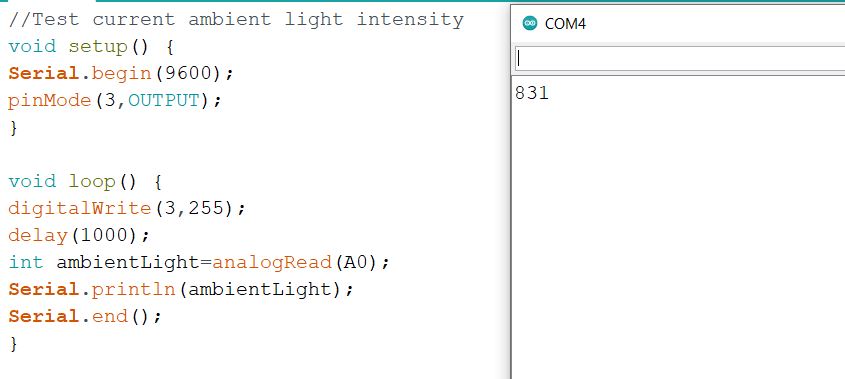
A maximum light intensity was checked using a LED. Figure
2. Testing the maximum light
intensity value that the LDR can detect.
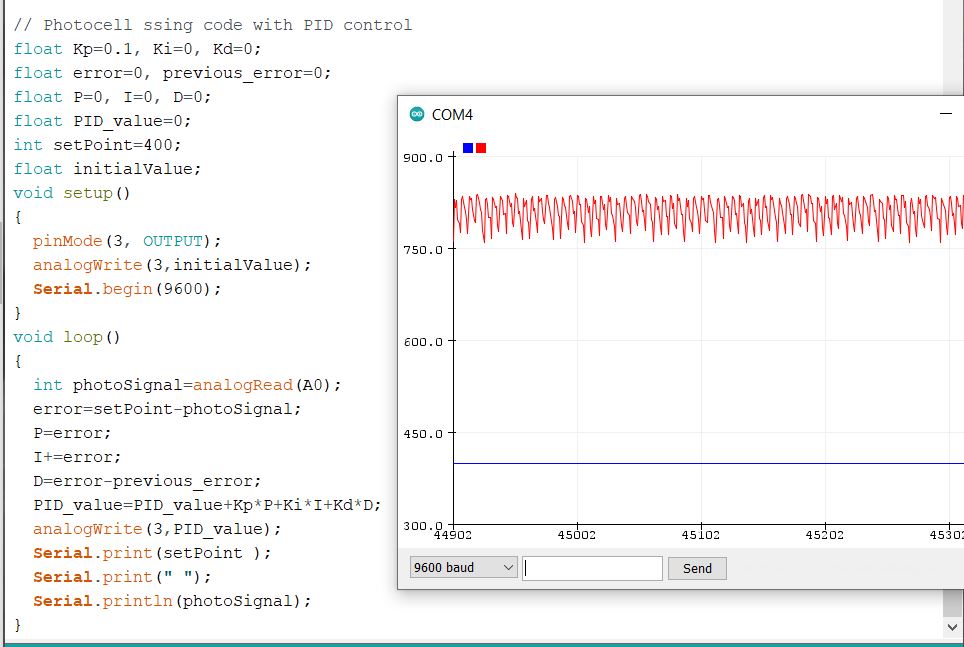
The setpoint was set below the ambient light detection, resulting in the graph
not being able to oscillate around the set point. Figure
3. Set point was set at 400.
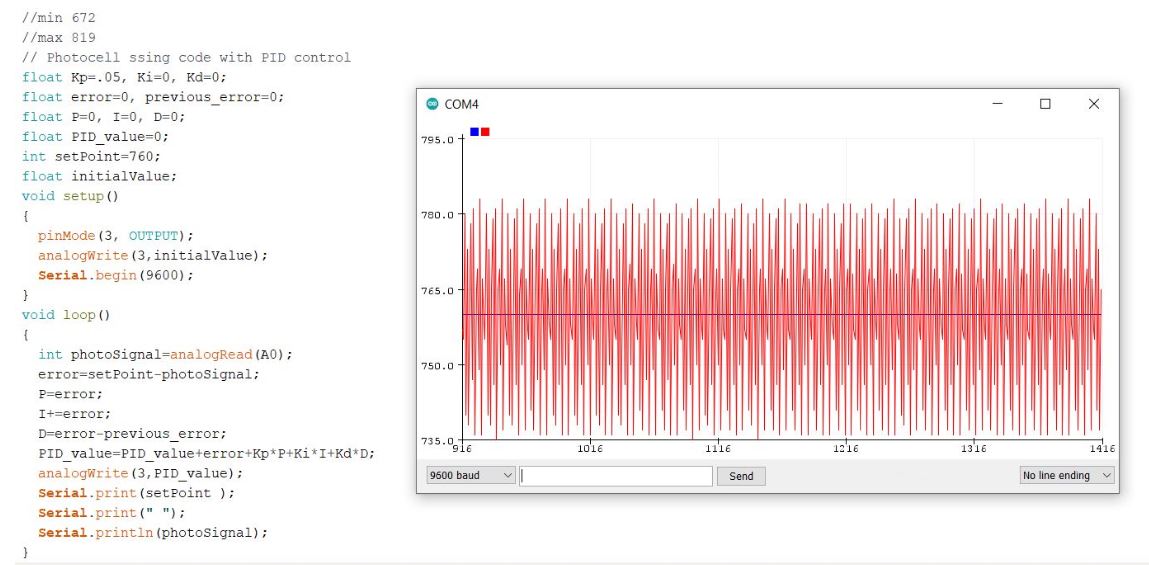
When the set point is set within range, the data can then oscillate around a
set point. Figure
4. The sensed light oscillates
around the setpoint fixed at 760.
A push button was added to the board along with a second LED. A second LED will
turn on when the button is pushed. In the video below, the light intensity of
the first LED will adjust in order to oscillate around the set point.
Figure
5. Light intensity adjusts to
keep oscillating around a set point with two LED and a push button.
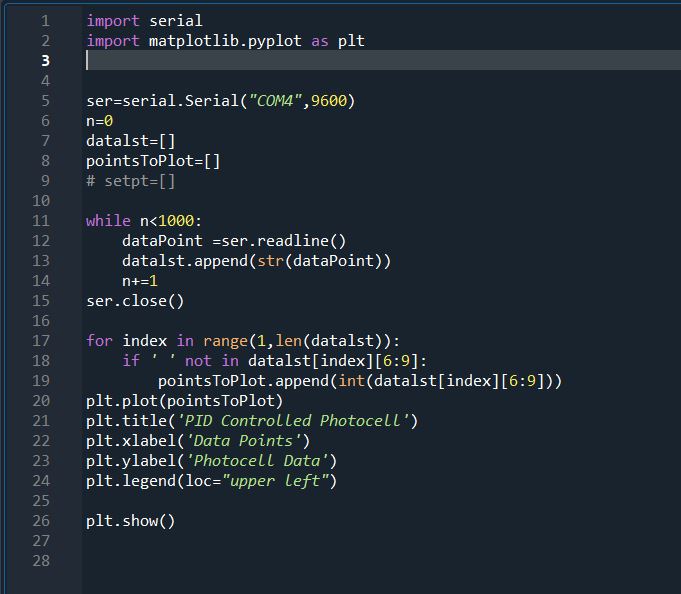
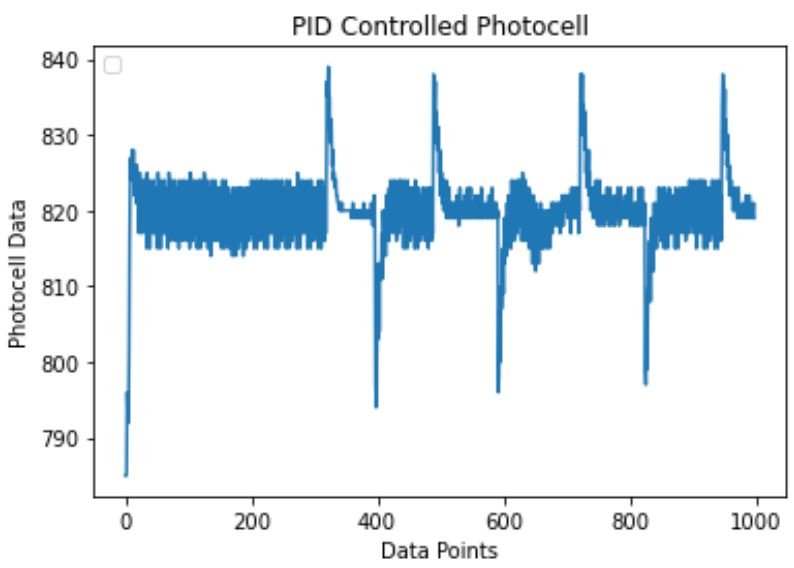
The Arduino serial data was read into python and graphed. Figure
6. Light intensity adjusts to
keep oscillating around a set point with two LED and a push button. Figure
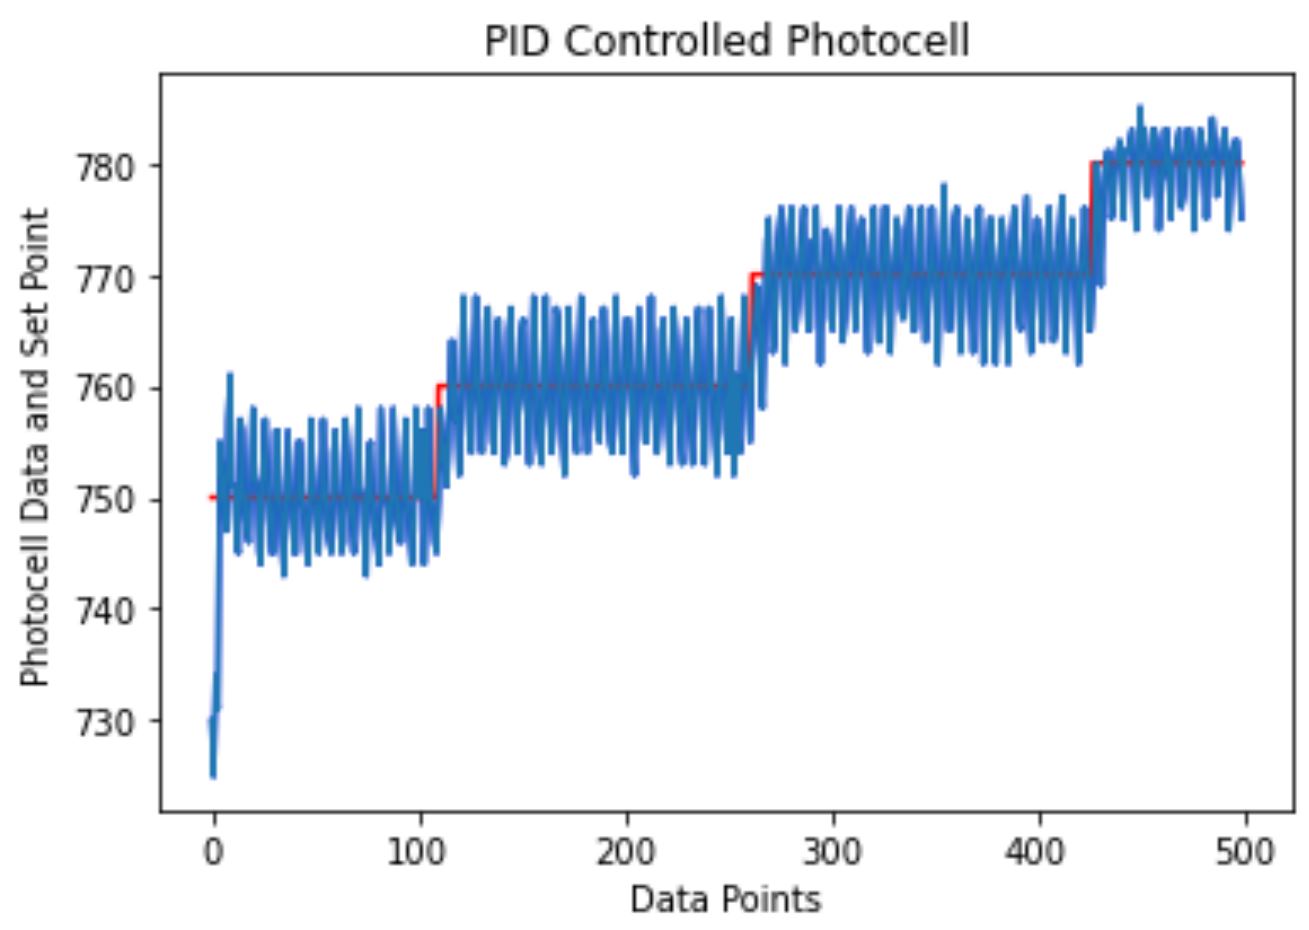
7. Python graph for Task 2. In the video below, the
setpoint would increment by 10 every time the button was pushed. The light intensity
data oscillates the set point path as the set point increases.
Figure
8. The data oscillating around
a changing set point.
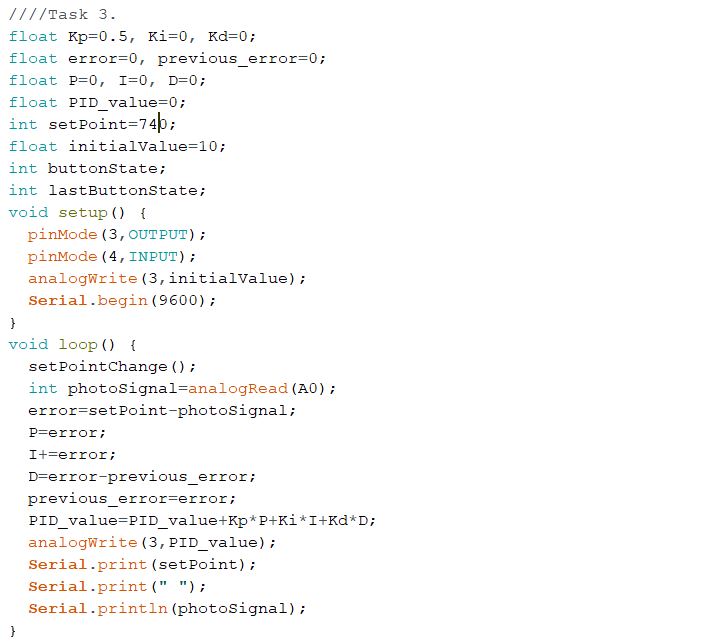
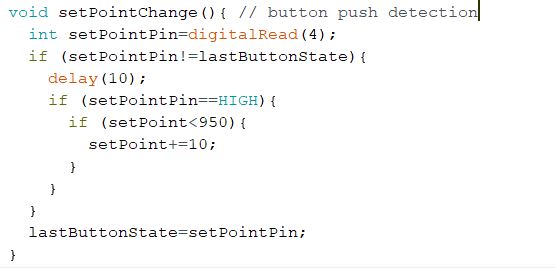
Figure
9. Code to have the data
oscillate around a changing set point.
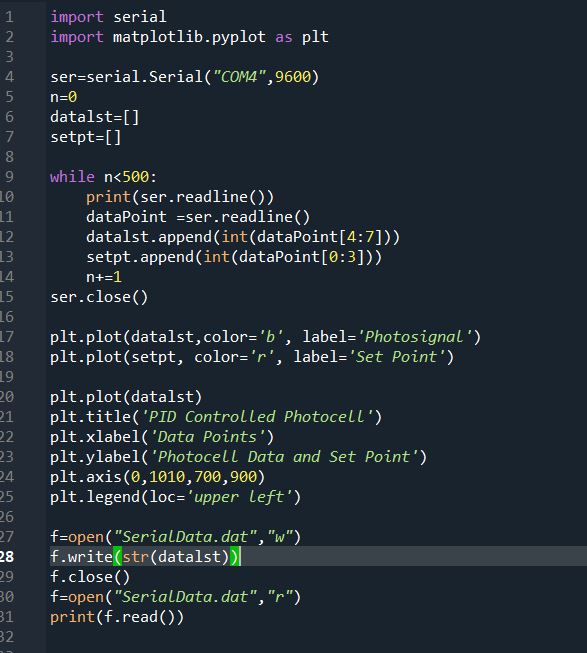
The
Arduino serial data was read into Python and graphed. Figure
8. Python code for Task 3.
Figure
9. Python graph for Task 3.
4.
Discussion
I was able to gain experience by working with the photoresistor and the PID
control feedback system. The photocell is very sensitive, and the lighting had
to be perfect. The most challenging part was coding in Python and getting the
axis to be readable.