CE 351 PID Control with Photocells
Name: Max Krauss
Email:
mtkrauss@fortlewis.edu
Task 1: Fix
the code above to make the sensed light oscillate around the setpoint
(use an appropriate setpoint). Complete the blocked line for the
'PID_value'.
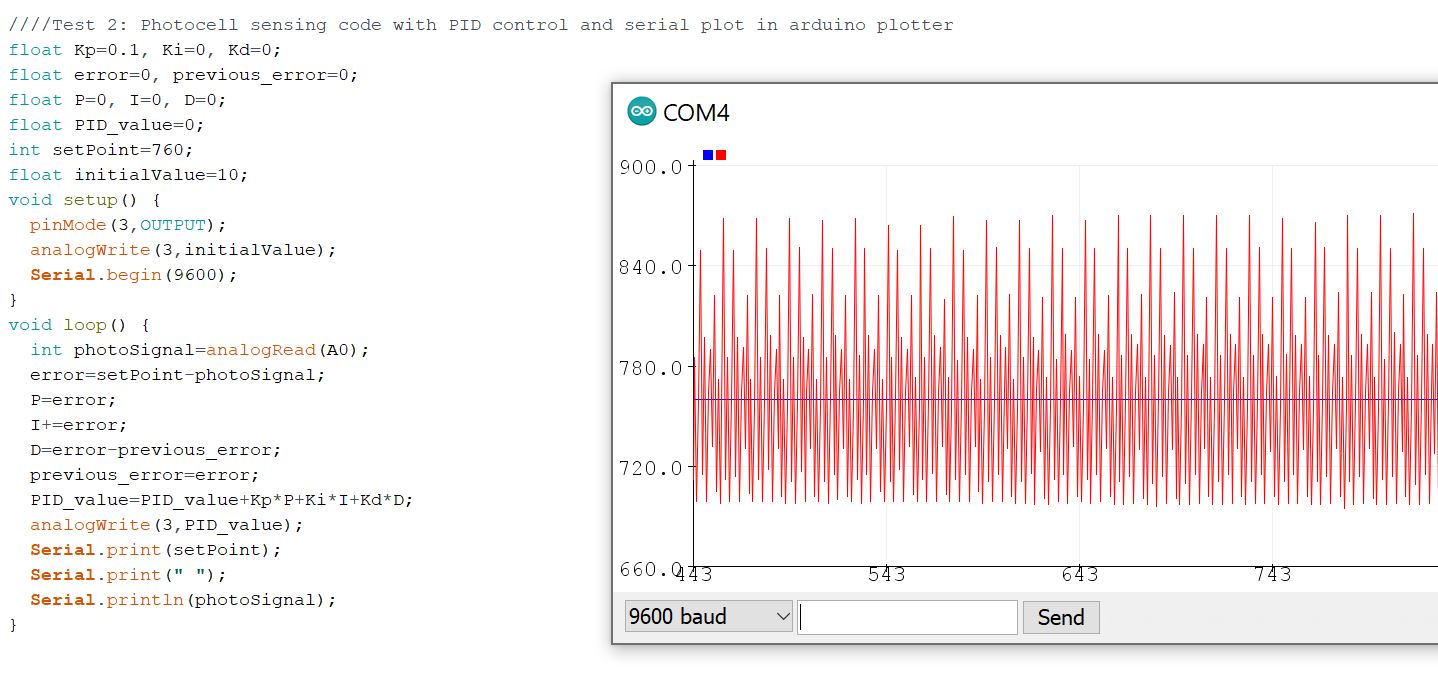
Figure 1: Light oscillating around a setpoint of 760.
Task 2: Repeat
the work in this section. Save the data in a local drive and plot your
data use Python and present your data in your report.
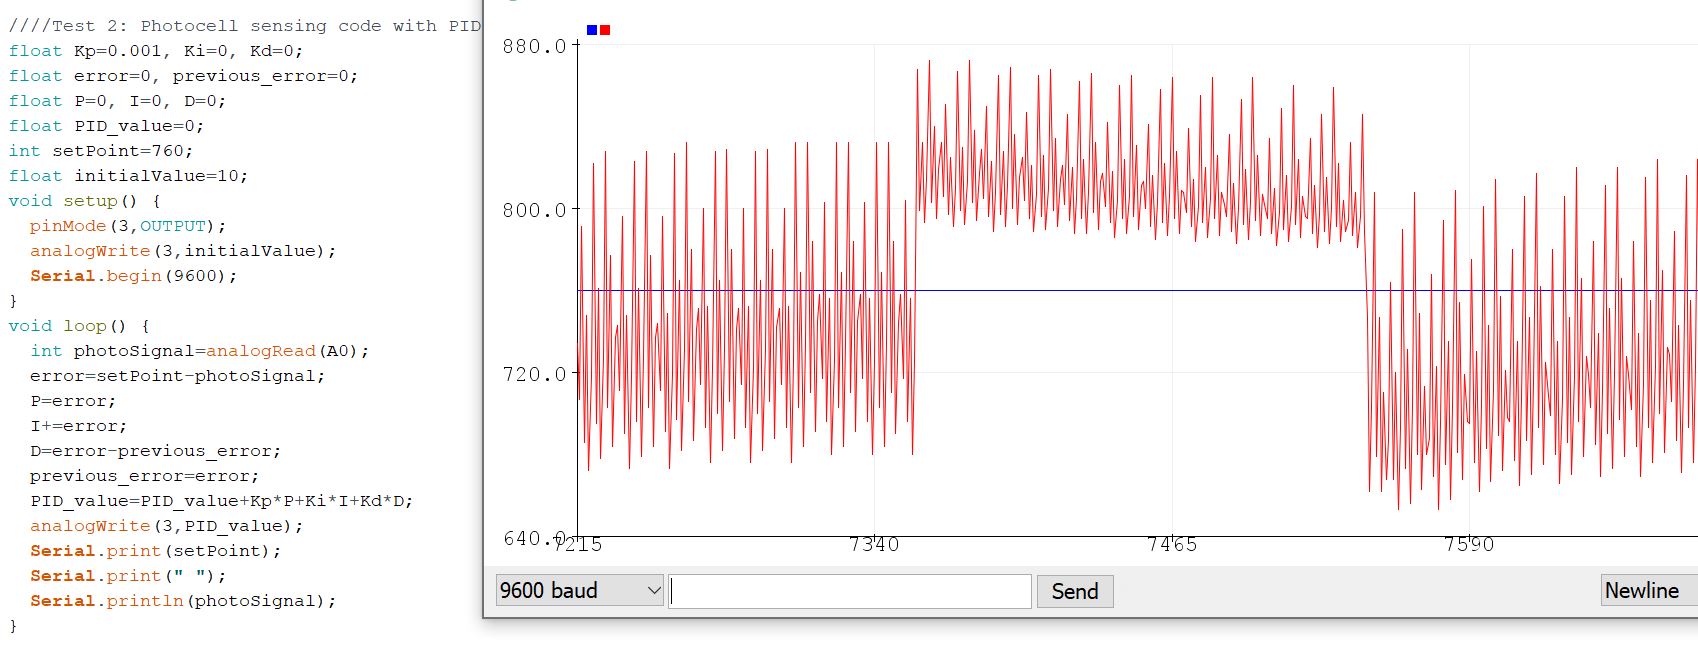
Figure 2.1: Repeated work for task 2 when Kp = 0.001
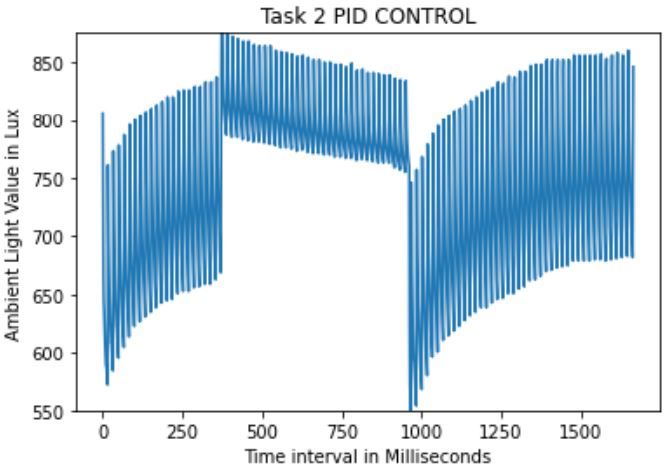
Figure 2.2: Data plotted in python.
Task 3:
Fix the setPointChange() function to enable the desired PID function as
follows. Plot both the SP and the sensor data in a same figure using
Python. Present your result in your report.
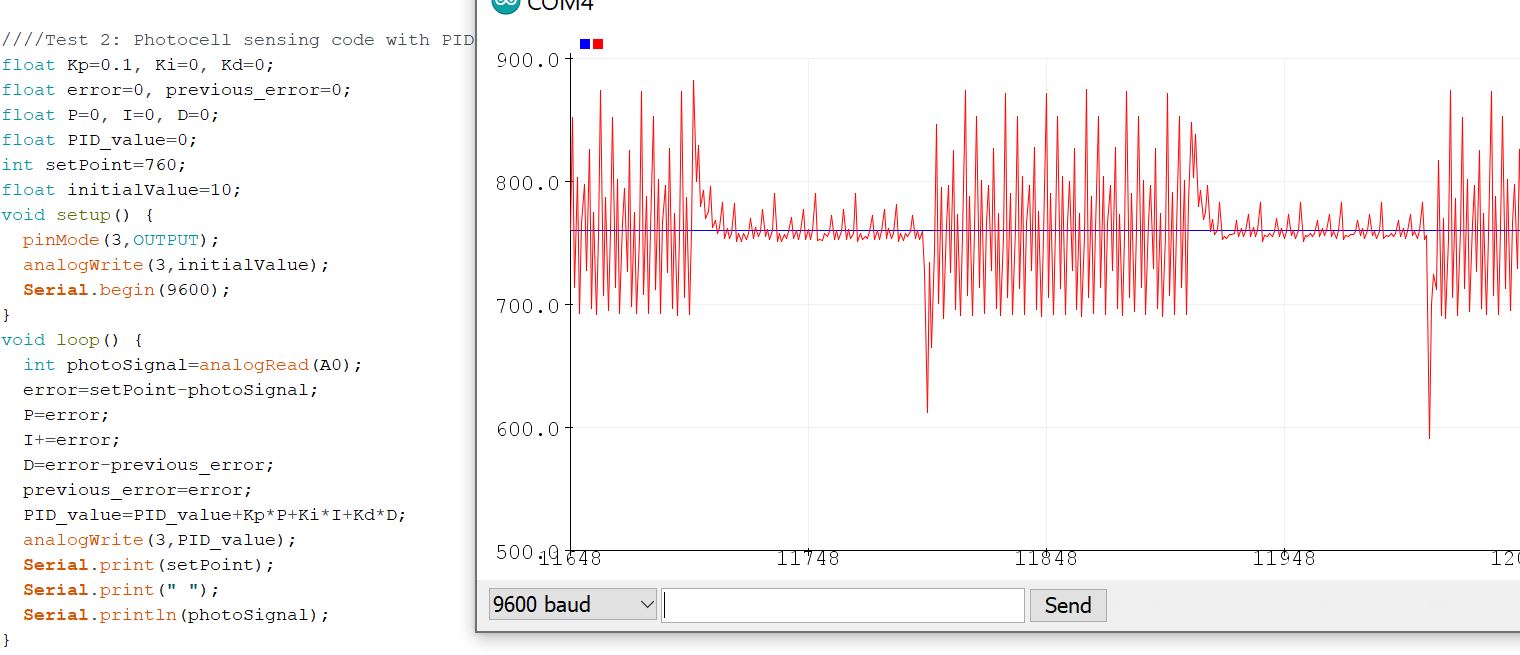
Figure 3.1: Repeated work for task 3 when Kp = 0.1
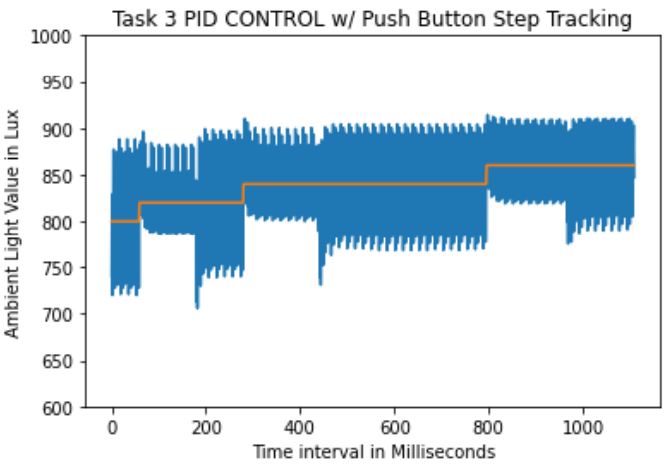
Figure 3.2: Data plotted in python with corresponding setpoint that increments by 20 each press.
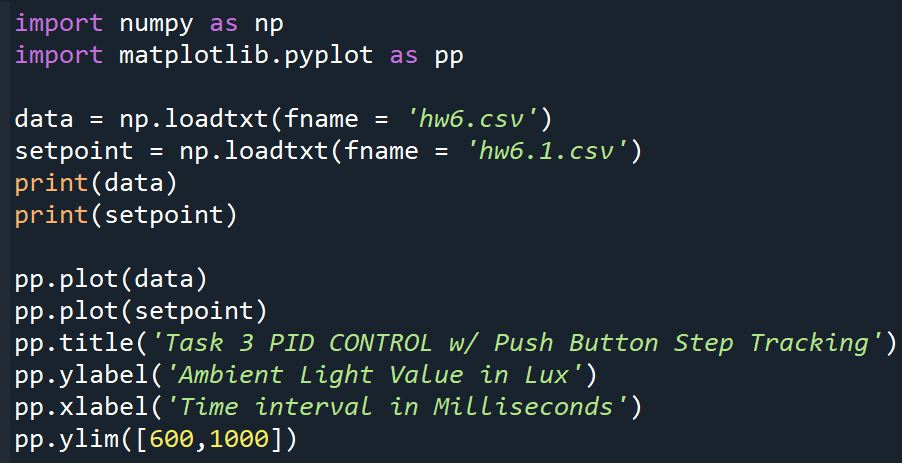
Figure 3.3: Code snippet for Figure 3.2, graphing in python with setpoint.
Results
: This tutorial introduced us to PID control and allowed us to
implement and visualize error correction with Photocells. The tutorial
was straight forward and was pretty intuitive with the code. I did have
trouble plotting the data in python, because I do not have much
experience with graphing in python.