Calvin Reese
cjreese@fortlewis.edu
5/30/2022
This is the complete guide to the Temperature Sensor GUI code. This code pulls data from ThingSpeak.com in a .json format and displays it in a much more manageable format.
All the important lines of code have been commented in the file below. I would advise downloading it for more detailed comments on what things do
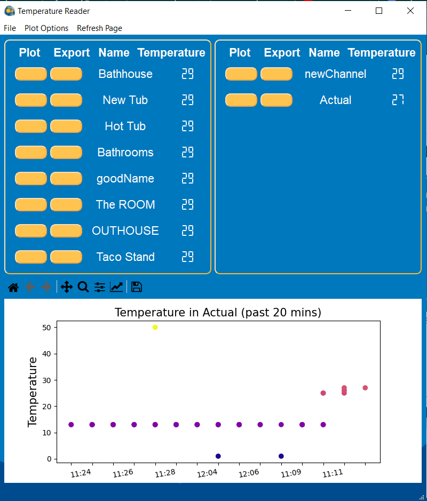
This is what the GUI looks like based on all the code below. See the stylesheets to edit the appearance of everything.
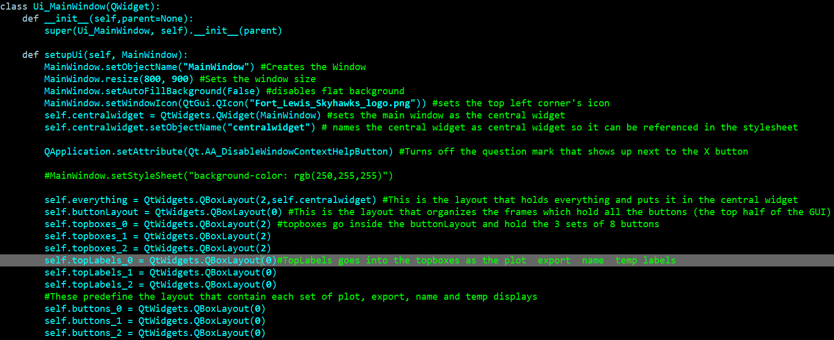
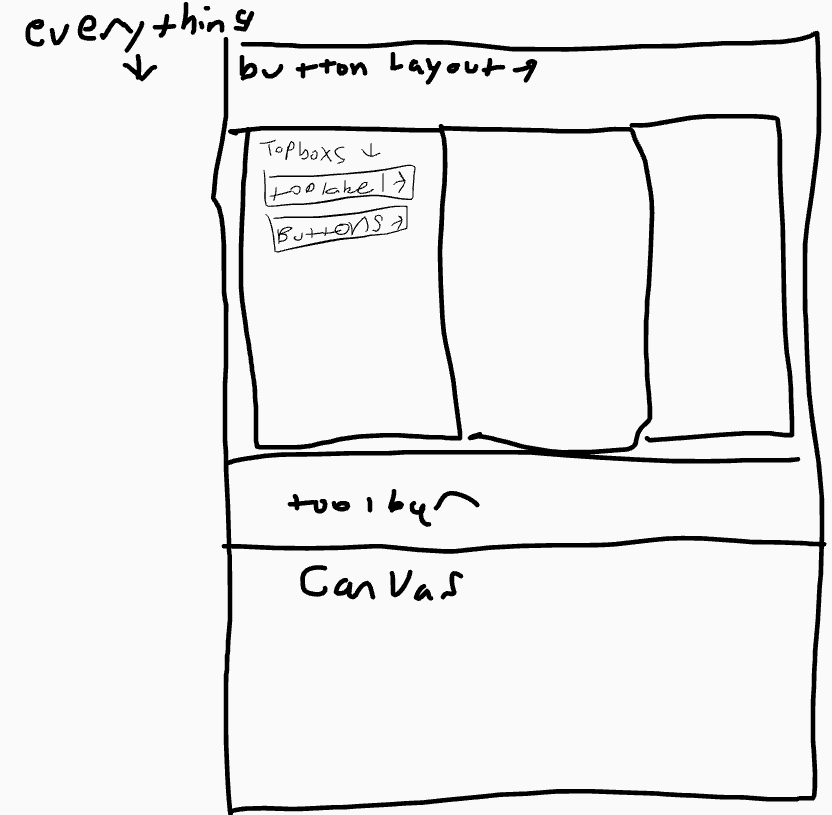
This section of code creates the main window and predefines all the layouts and widgets. The drawing is a crude map to how everything is layed out. Note that layouts are the order in which things are added together and widgets are what is seen and interactable. Layouts are put into frame widgets so the appearance of the internal widgets can be changed.
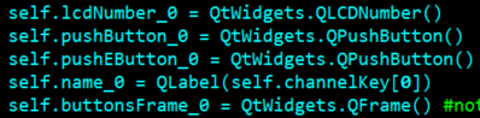
The buttonsDict holds the function names of all the widgets/layouts that are in the buttons sets. This enables me to use a for loop that can generate all the button sets at once instead of instantiating each one individually.

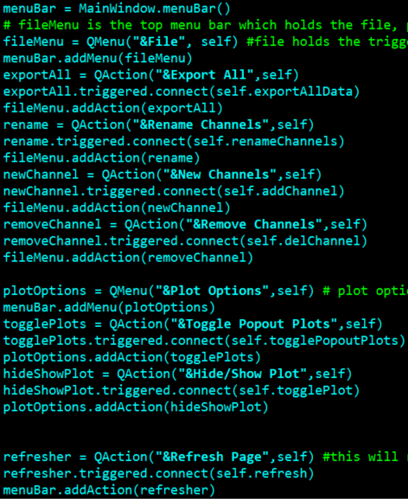
The menu bar code controls the buttons "file","plot options", and "refresh page". The QMenu can only hold buttons/dropdowns and the QActions are the buttons that can go into QMenus. The connect function is what connects them to their operation function defined later.
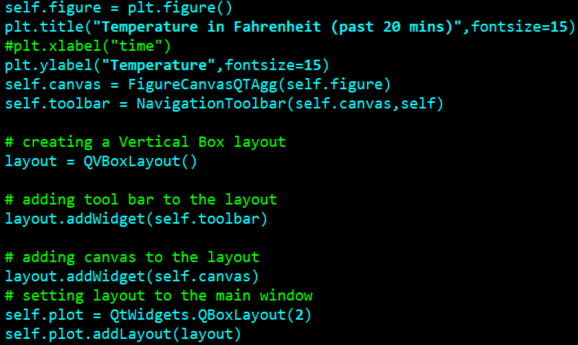
This section creates the placeholder that is the embedded plot. FigureCanvasQTAgg can also be used to make a drawing space, but in this case it holds a subplot of a figure that is defined the in the showData function
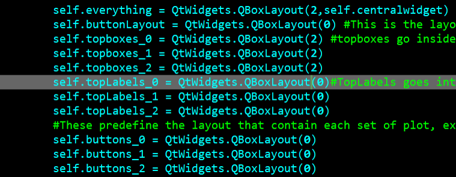
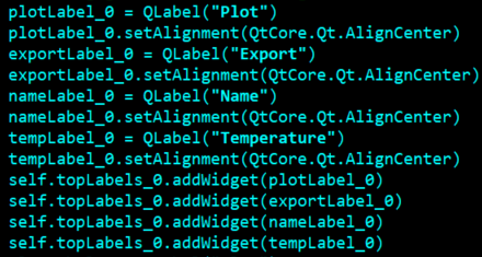
This code just makes the labels for each of the topboxes so the components are labeled with their function. Originally the QLabels were defined within the addWidget function of the topboxes layout, but to get the labels to be center aligned, I needed to make a seperate object that would also hold the alignment.
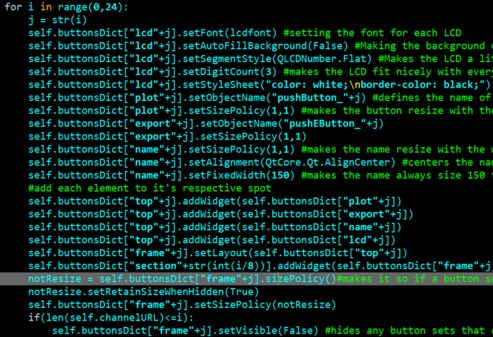
This is the for loop that the dictionary is used the most to generate all 24 button sets. The button stylesheet edits the color and style of each button depending on the state as well as the name font and the frame around the LCD number display. The name and LCD needed their sizes to be defined so that the buttons would have uniformity. removing the setDigitCount and/or setFizedWidth functions would make the button size depend on the available space instead of a set size. setSizePolicy is set to grow so that the if the window is resized, everything will grow with it. To get the buttons to get smaller if the window is resized smaller, the padding in the stylesheet was set to a negative number. (64 was the largest it would go without throwing an error).
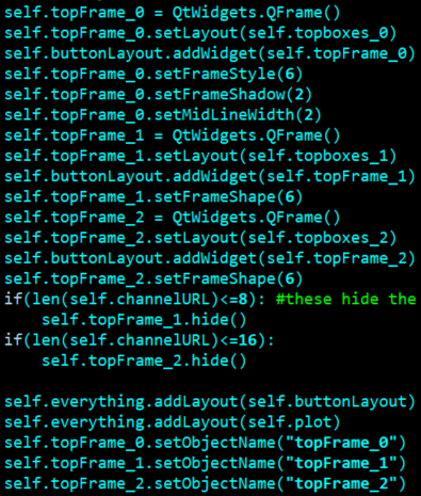
This set of functions actually place all the layouts/widgets where they are suppose to go. See the map above for reference
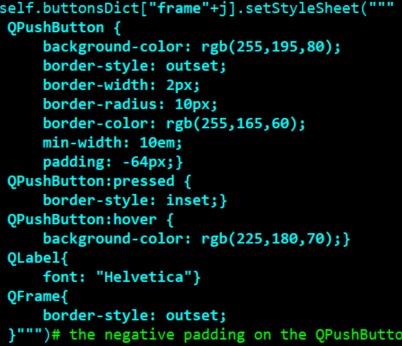
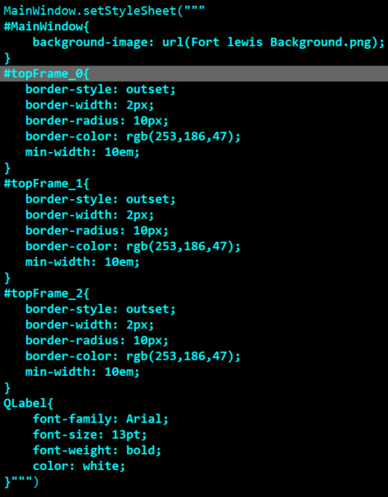
This is the stylesheet that determines what everything else looks like. The # makes the stylesheet reference the object name to modify a particular widget (set using setObjectName). If the topFrames_i were replaced with QFrame instead, every frame under MainWindow would have those characteristics. That is to make the frames around all the buttons visible with those characteristics, which isn't appealing. Note that instances of stylesheet deeper into a layout will override the settings of a stylesheet set higher in the heirarchy. For example, the name labels have a different font that is defined the button set for loop and is not overwritten by the arial font defined here.
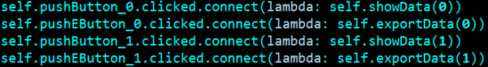
Here is where all the buttons are given their function. Usally the connect function only takes the name of the function and not a calling of it, but in order to pass a integer into the function, the lambda: flag was used. An example of how connect is usually called is "self.pushButton_0.clicked.connect(self.showData)".
This creates the status bar that will show the progress of loading in updated data. This shows up any time all the channels are loaded in at the same time

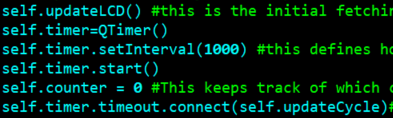
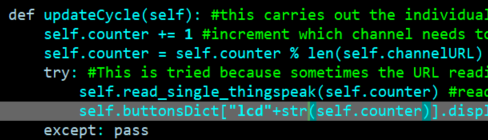
This timer will keep the lcd displays updated with current data. It cycles through all the channels instead of loading them all in at once to prevent the lag of such a large operation. Instead it will lag justfor a half second every 10 seconds while it fetches the new data of the channel in rotation.
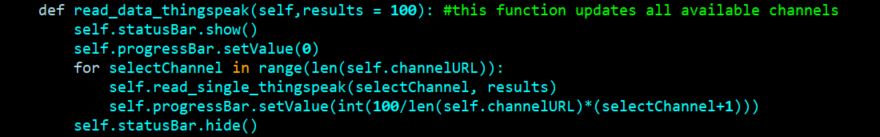
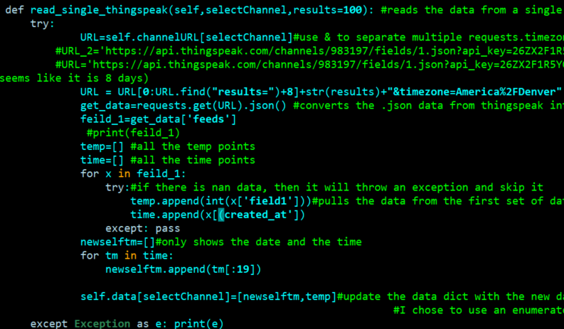
This code pulls the .json data from a channel using the channel ID, API, and the number of results requested. 100 is used as default, but 8000 is pulled instead when an export button is pushed. Mostly this just converts a json format to an array. The format for holding data is: [[[[times0],[temps0]],[[times1],[temps1]],...]
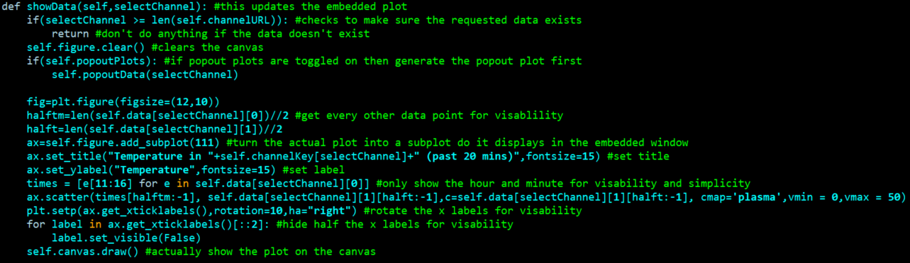
The plot uses matplotlib to create the figure. The canvas takes in a subplot instead of a figure, so the functions are a little different to edit the title/labels. cmap is the function that enables the color change based on the temperature. Most of the operations here are to edit the appearance of the plot to make things more visable.
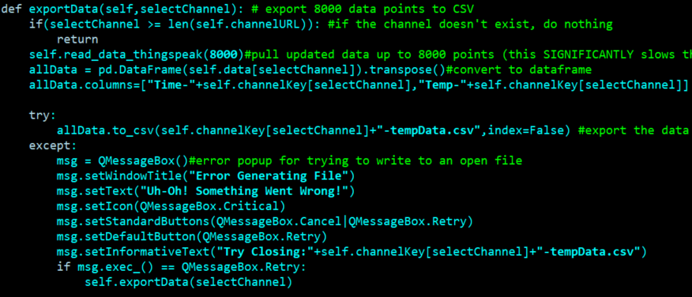
exporting the data is as simple as passing the times and temps into a pd.DataFrame, labeling the columns, and using the to_csv function to export the data. This is the first time the error message box is shown. This box is simply a popup that is displayed if there was an error with an operation. The details of the error and how to fix it is shown by setting the different parts of the message. The retry button is alsow mapped to re-call the function if it is pressed.
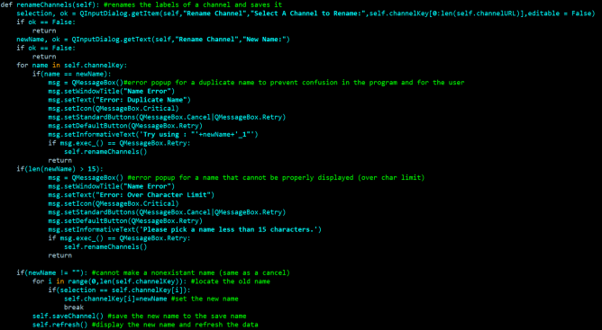
The rename function uses the QInputDialog function to create the popup boxes that will take in the channel selection and the new name. Most of the code here is error handeling since there are some limits on what a name can be. Firstly, no diplicate names can be made since when a selection is made, it will only pass on a string that is the selection and not an index from the given array. This means that if there is a duplicate, it will only choose the first instance of it to modify, which isn't always what is desired. Secondly, there is a 15 character limit on the names since the name tags will cut off anything that is longer than that. If the name is not empty, then it will attempt to change the name and save it. If it cannot save it, it will go through the final error messages since the only error that should show here is a permission error that happens if it tries to save to a file that is open.
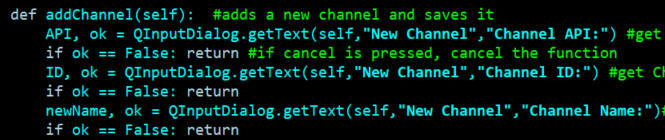
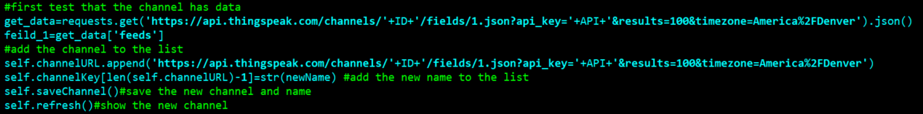
The add channel functionality is very simmailar to the rename function. The primary difference is that it also takes in a channel id and API. This is used to generate a link that is tested for validity. If the link is not valid then it will throw an error message. If it does work, then it will then attempt to save the new channel link and name to the save file and go through the same try/except process as the renaming procedure.
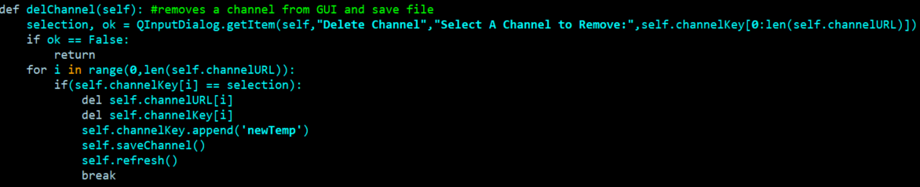
The remove function simply collects a selection from the user and removes it from the save file and the GUI
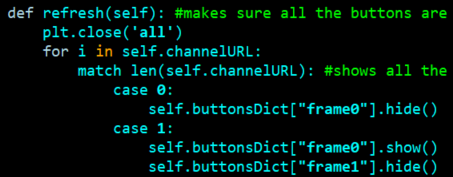
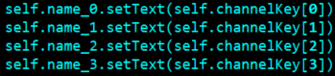
The refresh function uses the new python version of the switch/case function from C++ called match/case to decide which buttons to show and which to hide. It then makes sure that all the names displayed are correct by resetting them. Lastly it calls the updateLCD function to fetch the newest data and display it.
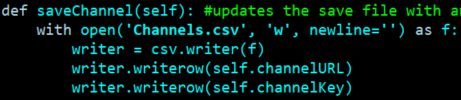
This is the save function that is used anytime the channels are modified so the next time the program is opened, everything will be the same
To generate the .exe file, type cd (directory to where the .py file is) then type:
pyinstaller --noconsole nameOfPyFile.py --noconfirm
In the Dist folder, add any files the program references and run the .exe file to launch the application
To add an icons to the exe file, download a .ico image and type "pyinstaller --noconsole v10_24LCDButtonExcelFinal.py --noconfirm --icon icon.ico
If it doesn't like pyinstaller, type "pip install pyinstaller" and if it asks if you want to add to PATH, then type "Y"
If it doesn't like pip, download the latest version of python here.