CE351 Final Project 2020 Fall
PID Lab continued: Python and Matlab Plotting
Name: Audra Benally
Email: albenally1@fortlewis.edu
1. Introduction
At the end
of this semester I had to be quarantined due to potential covid
exposure. As a result I was unable to complete the final project for
this class. As an alternative project I was assigned further additions
to the PID Lab 5. The following are the results: Python and Matlab
coding that gather data from the serial port then graph the data with
proper labels.
2. The Results
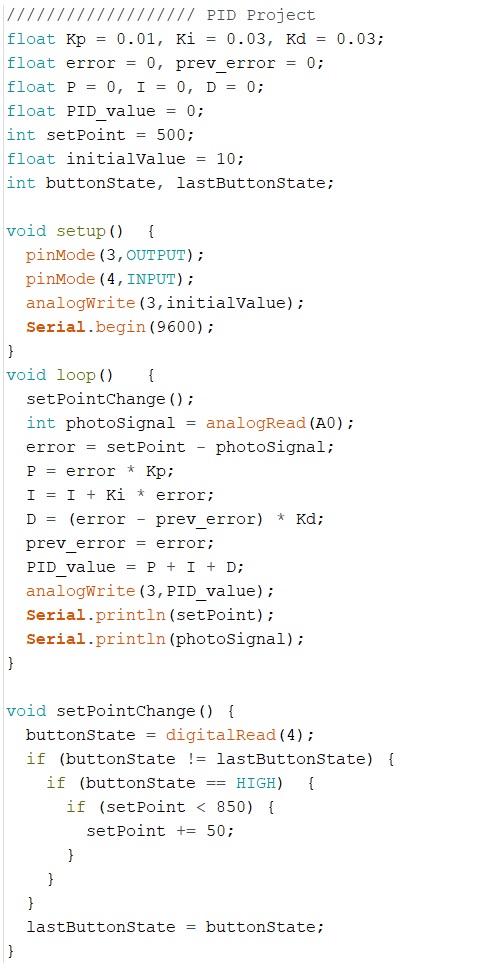
Arduino code:
Figure 1. Arduino code that is
uploaded to the microcontroller for the Matlab and Python code. I used
a method that prints the setPoint and photoSignal on two separate
lines; The python and matlab code collect in this specific way too.
 I have two videos that I
recorded using the canvas studio tab. I don't know how to put it in
here though. It is in "videos" in this file online.
I have two videos that I
recorded using the canvas studio tab. I don't know how to put it in
here though. It is in "videos" in this file online.
Python Code that reads data from Serial Port and Plots Data
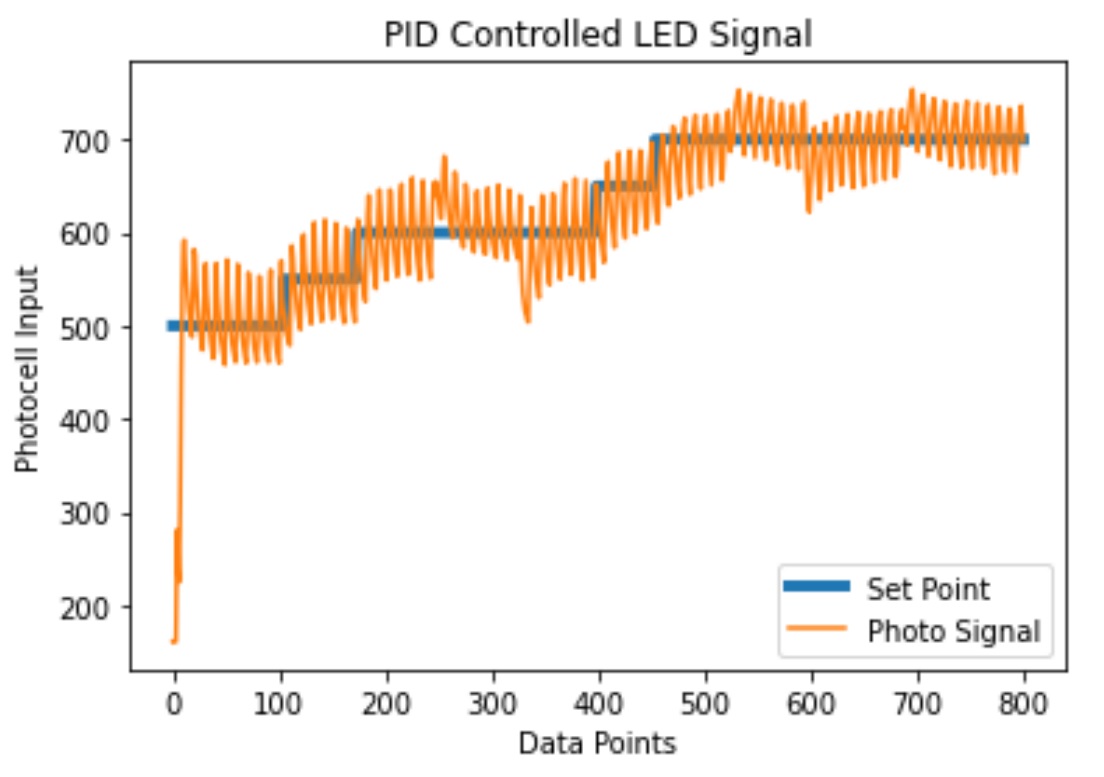
Figure 2.
Python graph plotted from data received from the serial port. Both the
setpoint tracking and external LED data are recorded in this graph. The
LED resets when the code
starts, so the first 10 or so data points are taken when the LED is
starting up. One issue that happens is the ser.readline() will read two
lines which results in a huge spike in the beginning (combined number
is in the 100,000 range). It didn't happen very often so I did not
think I needed to adjust my code for this phenomenon.
Matlab Code that reads Data from Serial Port and plots on a graph.
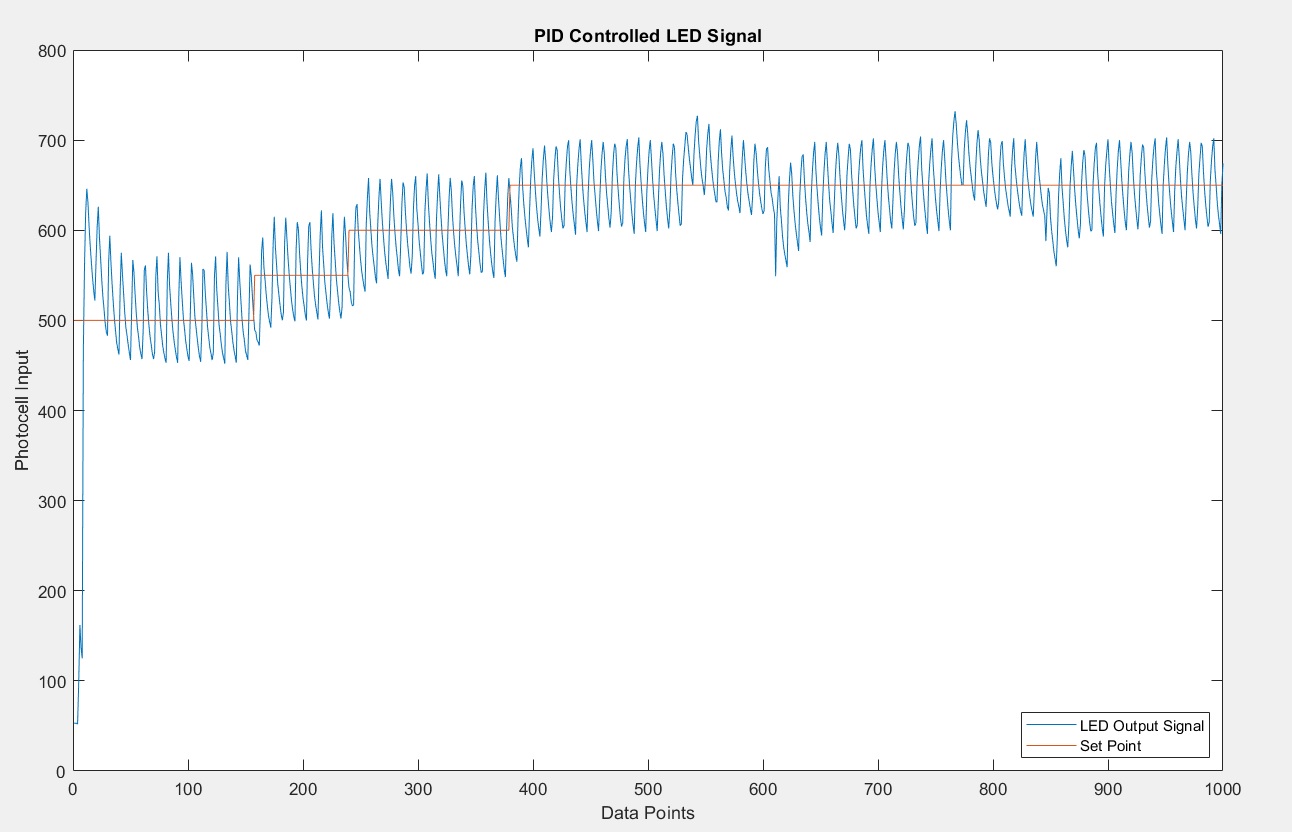
Figure 3.
Matlab data plot from data received from serial port. Both the setpoint tracking and external LED data are recorded in this graph. This data is also
taken as the LED starts up: you can see the lower data points in the
beginning.