Arduino
and Matlab Interface for UART Serial Communication
The Arduino board can be bought from the following links:
Arduino Official Website
Amazon
Except for this tutorial, you can refer to my ENGR 104 lectures in Fall 2017 at Fort Lewis College
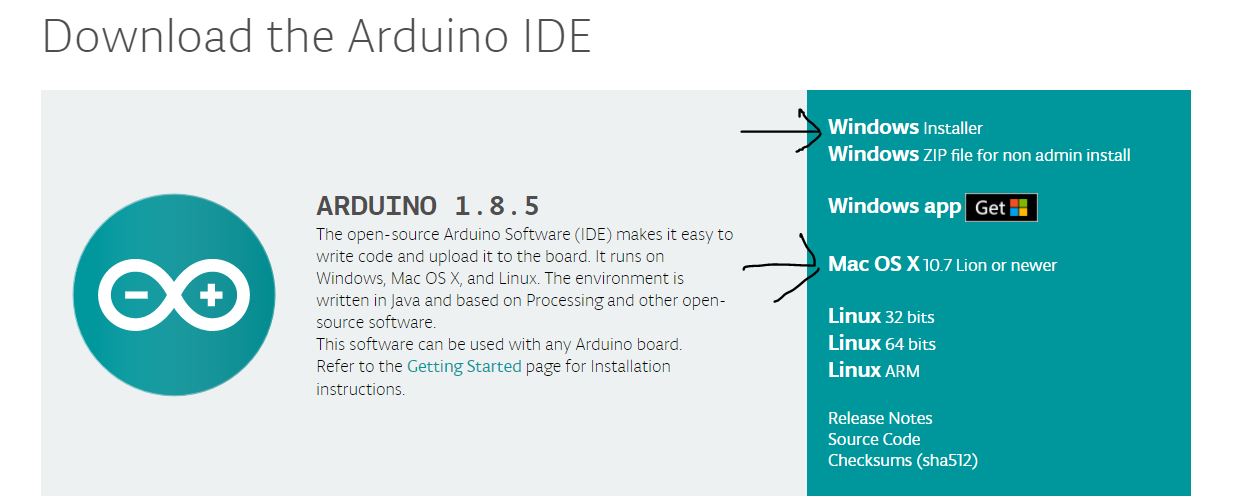
1. Download Arduino IDE to your PC
2.
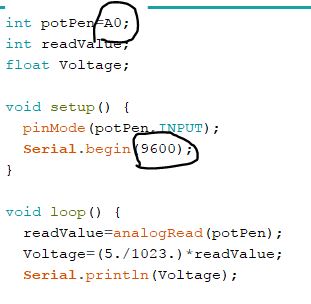
Connect the board to the PC using the USB cable from the kit, open
Arduino IDE. Delete all the default code in the window and copy-paste this code
to the window. In this code, the analog voltage output from your sensor
should be connected to the 'A0' port on the board. Make sure the common
ground pin of your sensor should be connected to the ground of the
Arduino board.
3.
The data transmit rate in this code is 9600 bit/s, every data point is
8 bits, so the sample rate is 9600/8=1200 samples per second. It can be
changed up to 2 million bits/s which is 2 million/8 = 250k
samples per second. I usually don't use the upper limit rate, you can
pick up a medium rate in the beginning to see the singal first, then
optimize the sampling rate.
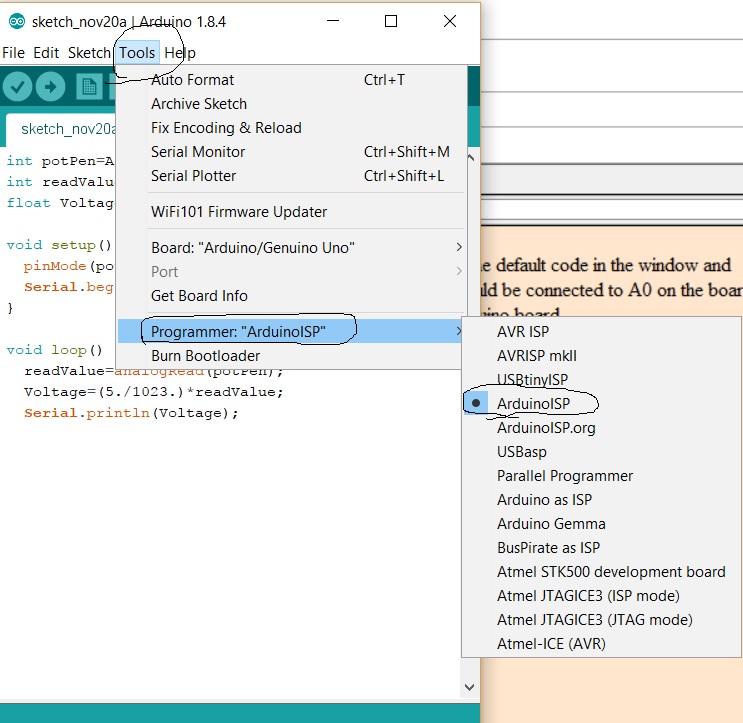
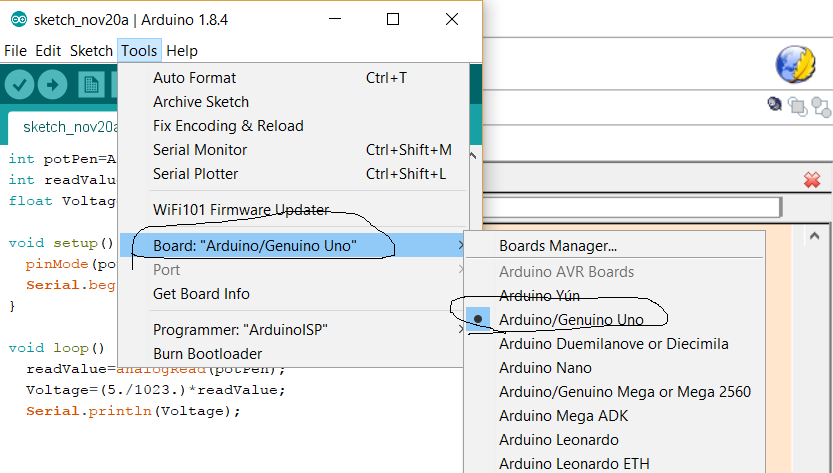
Go to the menu, Tools - Programmer: ArduinoISP.
Go to the menu, Tools - Board - Arduino/Genuino Uno:
Go
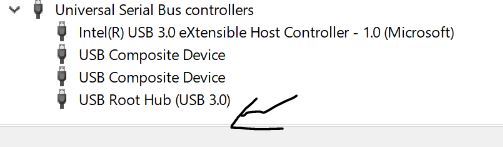
to Menu, Tools - Port - Select the correct COM port number you have.
The correct port number can be found in your 'Device Manager' of the
Windows Operation System. As the following figure, you should be able
to see a COM port there if you have your Arduino board conneccted to
your PC. The following figure doesn't have it since there is not a
board available when this tutorial is composed.
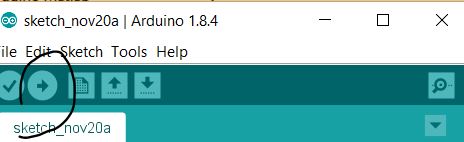
4. Download the code to Arduino to program the chip:
5.
Connect the sensor to Arduino, power up your sensors, connect the USB
of the board to the PC, now, the data is being sent to the PC already,
but we need a receiver in your PC to collect and process the data.
Run MatLab and open a new script:
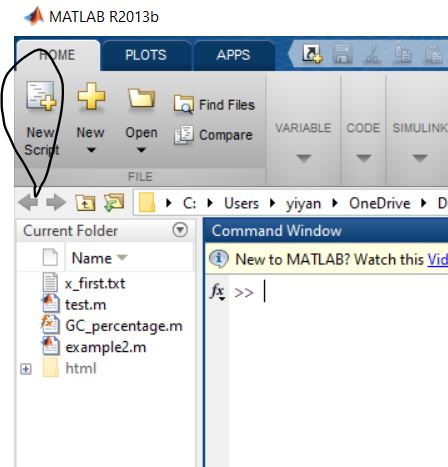
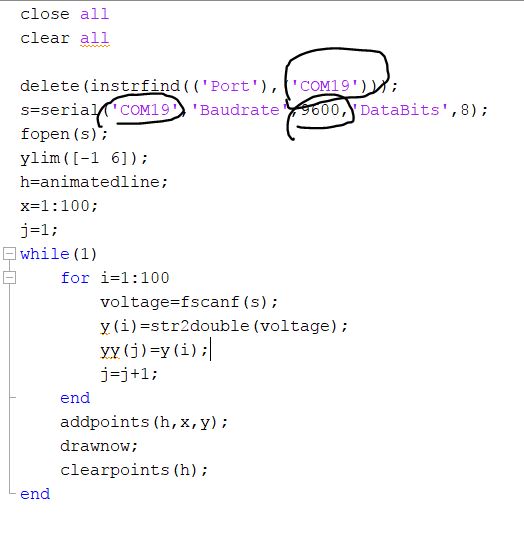
Copy and paste this code to your script window.
The data transmit rate and the COM port number should be consistent to the Arduino settings.
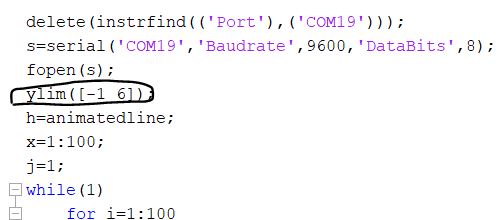
Run
the MatLab code, you should be able to see the signal. If you can't see
the signal, check the 'ylim'. If the Y axis scale is not in range,
modify it until you can see the signal.
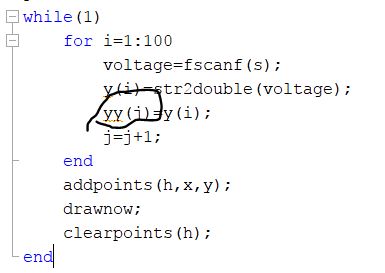
6.
This matlab code is for a time course analog data scanning. As you can
read from the code, the data will be stored in matrix 'yy'. You can
save your data using 'save yy.mat' for future analysis.
7. You can also use 'plot(yy)' to see how the data looks like.
8.
When you want to stop the data acquisition, go to the MatLab command
window, put a cursor in there, and press 'ctrl+c', the program will be
forced to stop.
9.
This matlab code is doing a 'sample 100 pionts - display - drop'
acquisition, On the monitor, you will always see 100 data points
showing and then being refreshed by another 100 points. The reason to
do this is all the collected data won't accumulate in the monitor and
give the user a smooth time-course display. There is another version of
code does not have this function, all the points will stay in the
monitor. That code can be found here.