Lecture
39 GUI - PyQt V
Now, let's start the adventure of data acquisition using serial communication and Python!
When
you start planning on a project, the first thing is to know the final
purpose and all the objects that will be used for to achieve this
purpose. The most common strategy is to test every single part of the
entire project one-by-one using established equipment or tools so we
are adding a new variable to the system one-by-one. If it doesn't work,
we know where is the problem.
Let's take a look at the big picture of the project now:
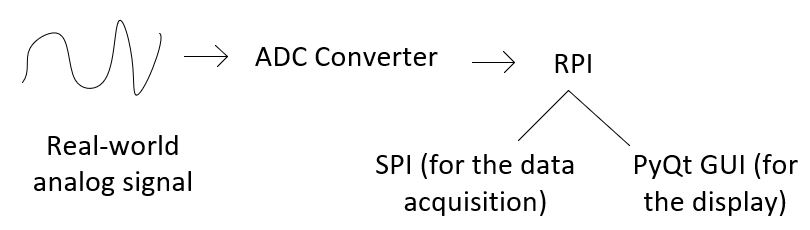
There are several 'variables' for me before I start this project:
a. I don't know if the ADC converter IC chip will work properly with the RPI board.
b. I don't know if SPI digital communication between the ADC and the RPI works.
c. I don't know how to build the GUI with Python to plot a live data (animation).
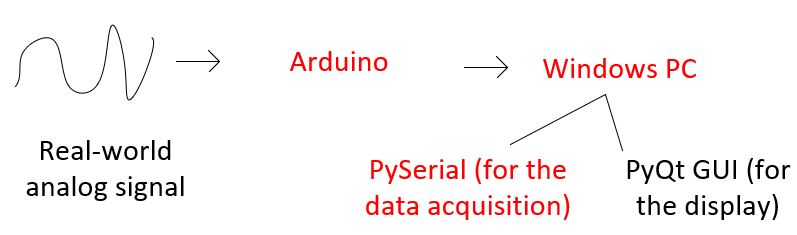
However,
based on our experience (if you took my ENGR 104), we know that the ADC
converter on the Arduino Board works fine with Windows and Matlab. Now,
let's don't touch the ADC converter IC chip yet, but let's use the
'Established Arduino Serial Communication Code', to test if PyQt Live Plot in
Python works in the same way as Matlab, so we can get rid of the PyQt Live Plot 'Variable' from the Design Flow, which means we know PyQt Live Plot
works and if the final system doesn't work, the problem must be
somewhere else.
1. Arduino ADC + Windows + Matplotlib + PySerial (to test if PySerial works)
-------------------------update your RPI required-------------------------
Matplotlib in RPI: (this is the only way I found works for installing matplotlib to RPI)
1) update first: sudo apt-get update
2) install matplotlib to your RPI: sudo apt-get install python3-matplotlib
-------------------------update your RPI required-------------------------
Refer to the serial communication lectures from Nov 2 to Nov 30 at this page:
http://yilectronics.com/Courses/ENGR104/ENGR104_2018f/lectures.html
If you were not in my ENGR 104, it is fine, just refer to the lectures on Nov 2 and Nov 5 will be good enough.
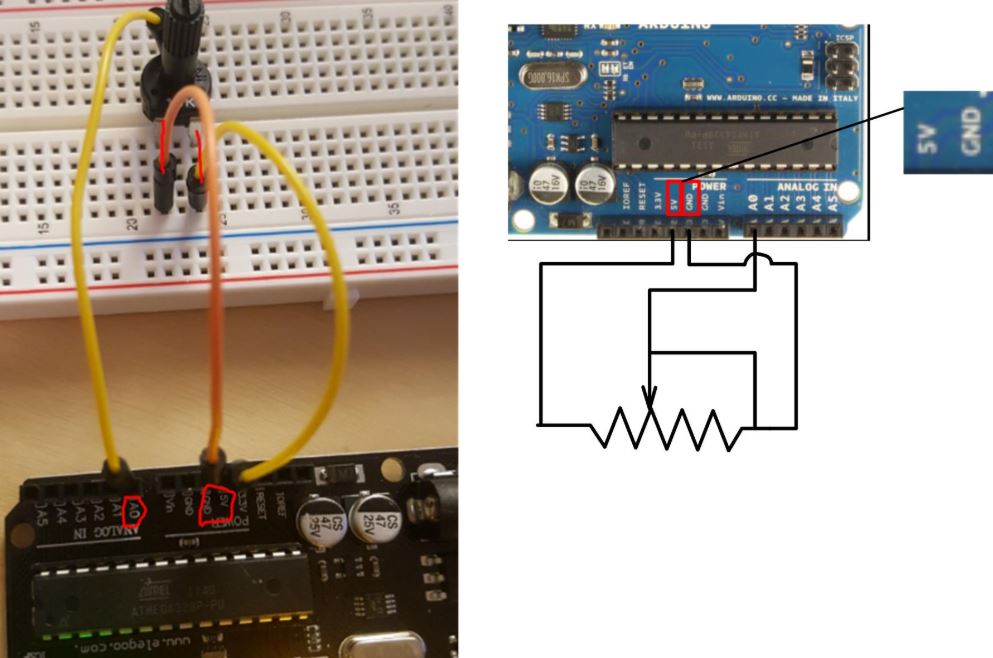
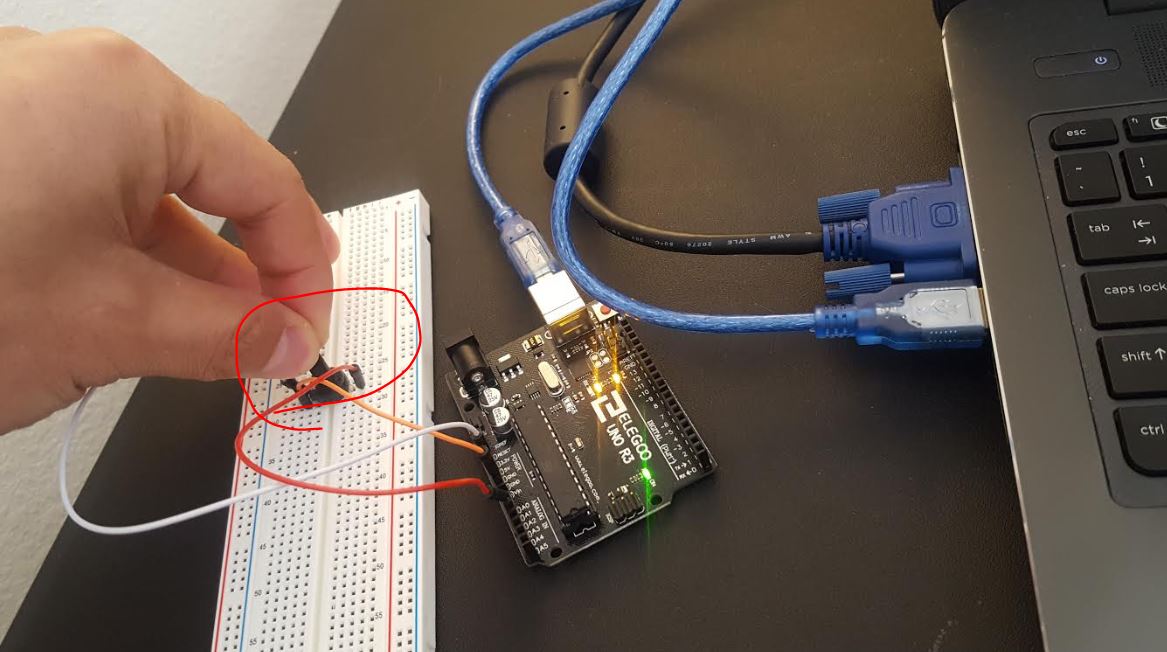
Frist, connect the potentiometer to the Arduino board as follows:
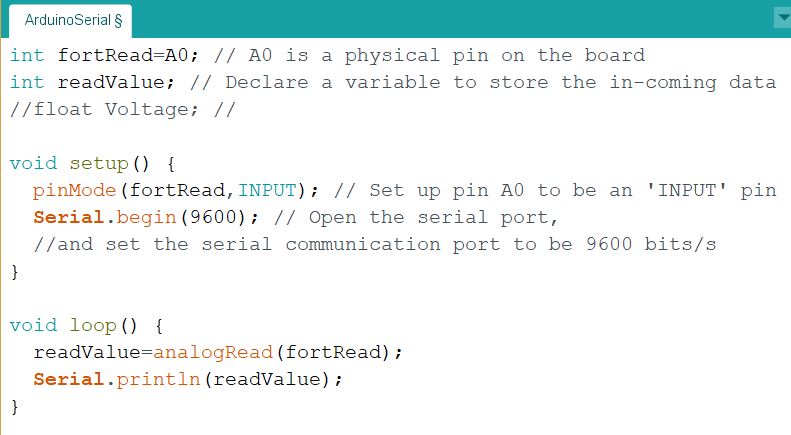
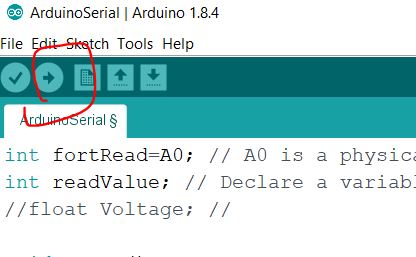
Open the portable Arduino IDE and download this code to the board:
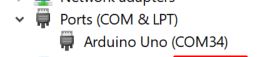
Check the port being used by the Arduino board:
Run the code to the Arduino board to let the data stream to your PC.
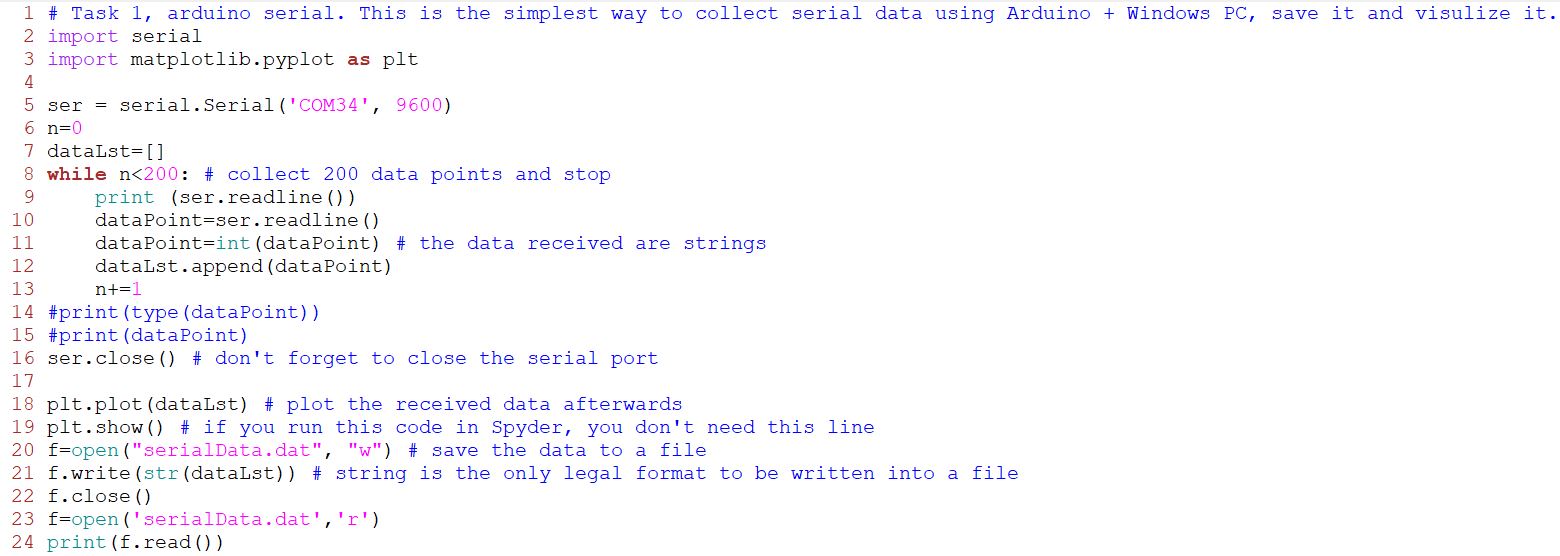
Now we need a Python code on your PC to handle these data stream in through the USB port:
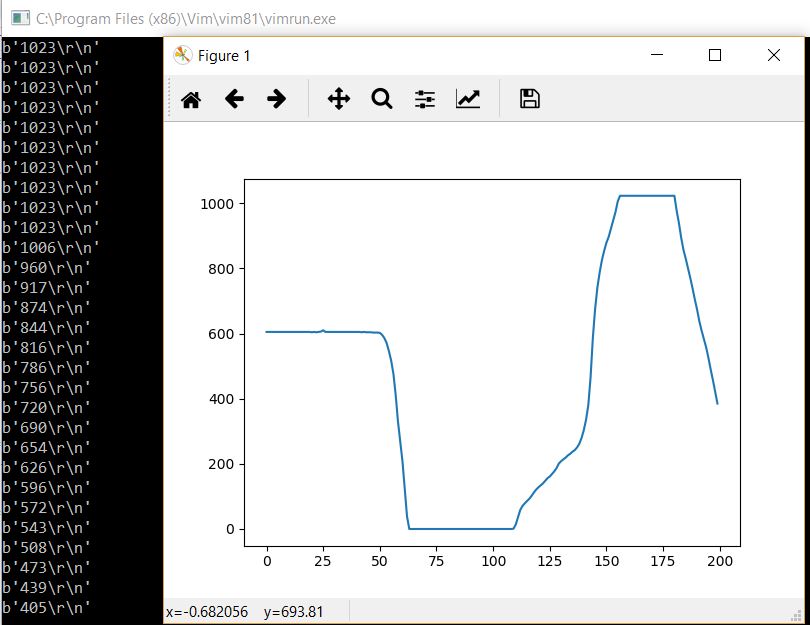
Twist the potentiometer when the data is being collected so you can get a curve:
A
quick question: Given that the resolution of the ADC is 2^10. In the
received data, why the maximum number is 1024 and why the minimum
number is 0?
You don't have to just collect 200 points, you can collect more if you like but it will take longer time to complete it.
We saw the data was received and plotted using Arduino ADC + Windows + Matplotlib + PySerial, now, the conlusion is the PySerial Class works. This
is like if you'd like to drive to Denver, you know the highway is not
jammed or broken or covered by snow. The highway is good and clean, you
just need to find a ride to get there.
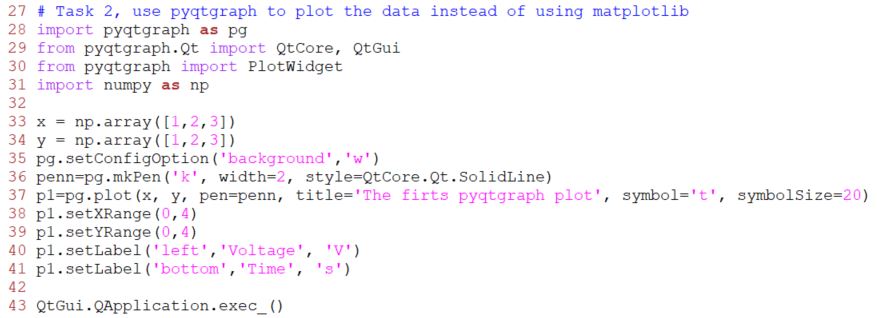
2. Use the Class 'pyqtgraph' to plot the data instead of using the Class 'matplotlib' (to test pyqtgraph offline)
Since we are going to use the 'pyqtgraph' to plot the data in our GUI, so let's test some simple plotting code with it:
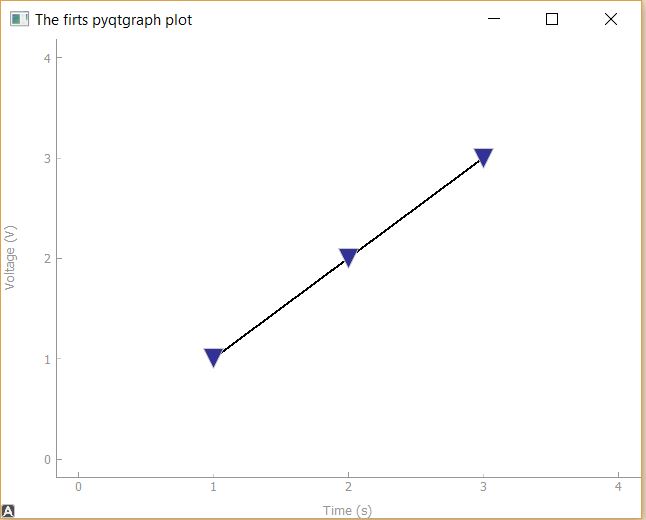
The result from the code above:
Let's try to plot it in a GUI
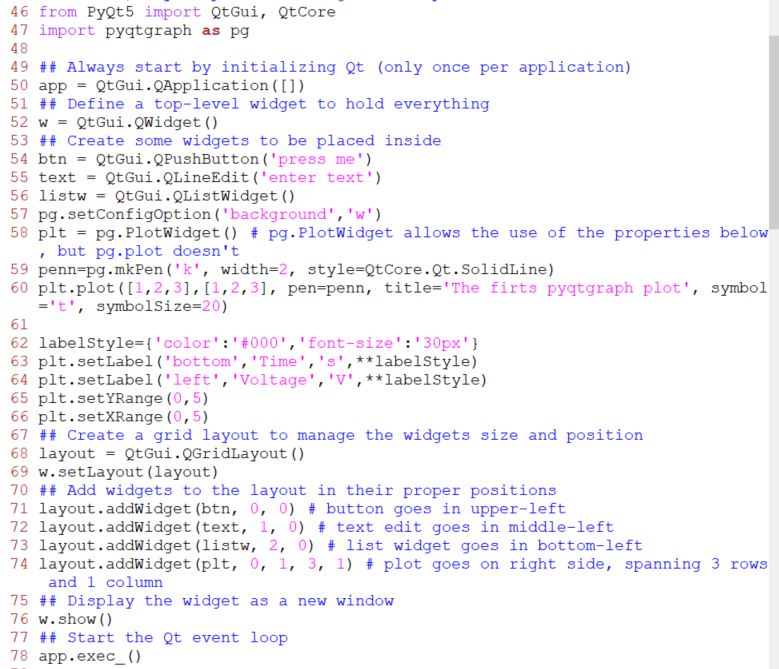
Here is the result:
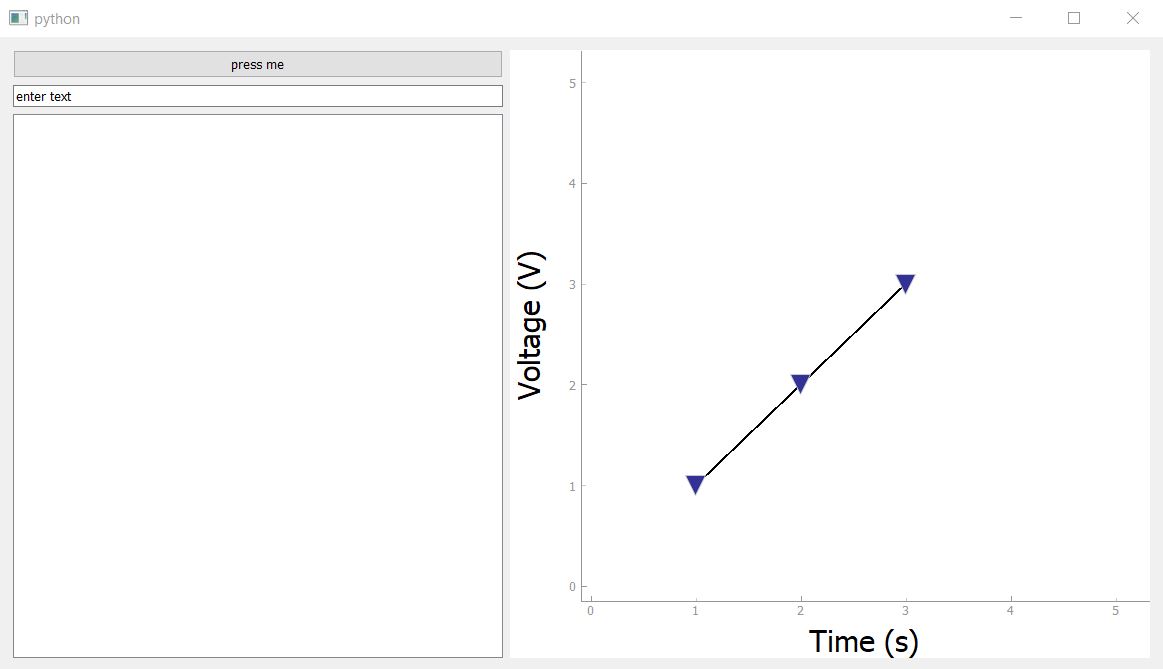
The
pushbutton and the cells in this form do not have any functions behind
it. The layout designated an area at the right side of the entire
window
3. Live plot in a PyQt GUI using pyqtgraph (to test if the live plot with 'pyqtgraph' and PyQt5 works)
Here
we build a Class called 'ExampleApp' to host the PlotWidget of
pyqtgraph. The ExampleApp Class has a parent class of 'QMainWindow'.
Refer to the 'PyQt GUI' lecture series here to recall the details of
this inheritance:
http://yilectronics.com/Courses/CE232/Spring2019/lectures/lecture35_GUI_PyQt_II/lec35_GUI_PyQt_II.html
The code for this application is:
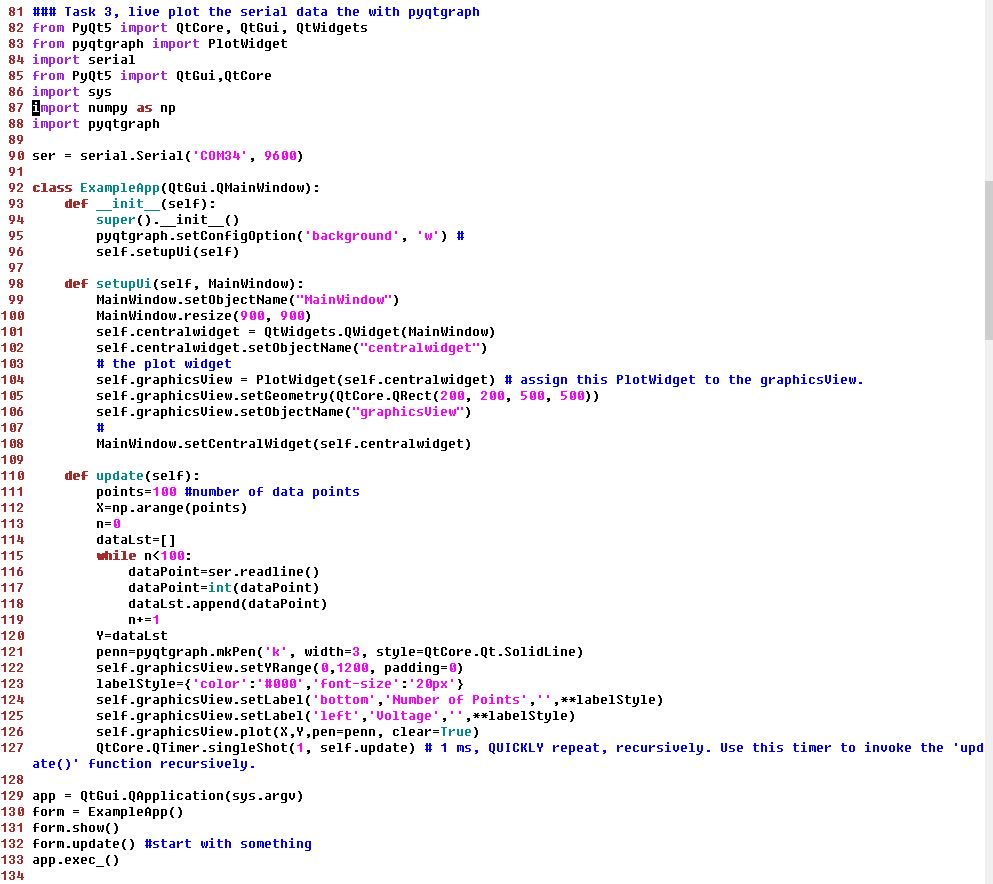
This
code is running independtly without calling any other QtGui .py files
generated by the Qt Designer. You don't have to code up everything like
what I did here in the code above in real-life. I'll show you the
example of utilizing Qt Designer to make the GUI interface design
easier in the end of this tutorial. Now, let's jsut use this code to
complete the task first.
The hardware connection is still the same:
The live plot will look like this:
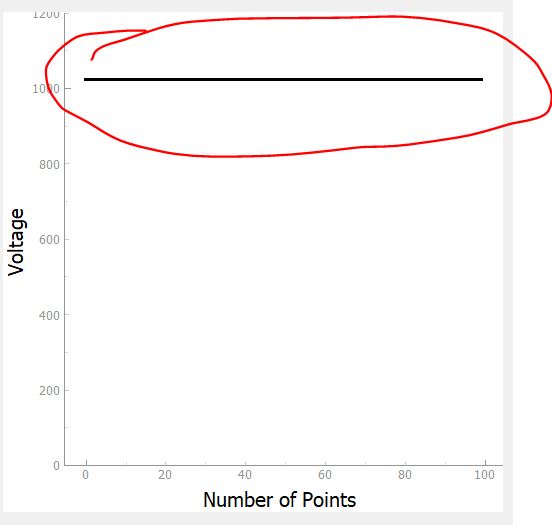
Now,
we are pretty confident with PyQt5 and pyqtgraph for live plot received
data in a GUI window. These libraries can be trasferred to the RPI
board to do the similar job. We are about 70% done for our entire
project.
4. ADC (SPI communication) to RPI Communication
-------------------------update your RPI required (Install pyqtgraph to the RPI:)-------------------------
sudo apt-get install python-pip
sudo pip3 install pyqtgraph
-------------------------update your RPI required-------------------------
The
Raspberry Pi do not have the analog input pins which means that you
cannot get the analog inputs with Raspberry Pi but we can overcome this
problem by using the analog to digital converter which will help in
interfacing the analog sensors with the Raspberry Pi. So in this
tutorial, you are going to learn about MCP3008 Raspberry Pi interfacing.
We
are going to use a 10-bit Analog-to-Digital Converter (ADC) - MCP 3008
to aquisite the analog voltage data from our potentiometer and send the
data to the RPI board. There are many tutorials online:
https://electronicshobbyists.com/raspberry-pi-analog-sensing-mcp3008-raspberry-pi-interfacing/
https://learn.adafruit.com/raspberry-pi-analog-to-digital-converters/mcp3008
It
doesn't matter which one you want to use. The SPI communication
protocol is different from the UART serials communication (which the
PySerial does). So we are not going to use the PySerial to talk to the
sensor anymore. However, all these communication protocol is
complicated in logic and you don't need to know what is happening
behind the scenes. You just need to know how to connect the wires
together and how to use them using standard libraries.
You
must be wondering why we don't use the UART communication to send data
from Arduino to the RPI board since we already have the PySerial code.
The reason is the Arduino is based on the 5 V logic but the RPI board
uses the 3.3 V logic. You must use a Level Shifter between these two
devices to bring them to the same digital logic which introduces
unnecessary complexity to this class. Instead, we will use a single IC
chip (MCP 3008) to replace the Arduino Board for the data acquisition.
MCP3008
MCP3008
is a 10bit 8-channel ADC (Analog to digital converter) which uses the
SPI bus protocol and allows you to get the analog inputs with Raspberry
Pi. It is cheap and don’t require any additional components with it. It
gives you 8 analog inputs and it uses just four pins of Raspberry Pi
excluding the power and ground pins. MCP3008 is a 10 bit ADC so it will
give us output up to (2 to the power of 10) = 1023. So the output will
be a range from 0-1023 where 0 means 0V and 1023 means 3.3V
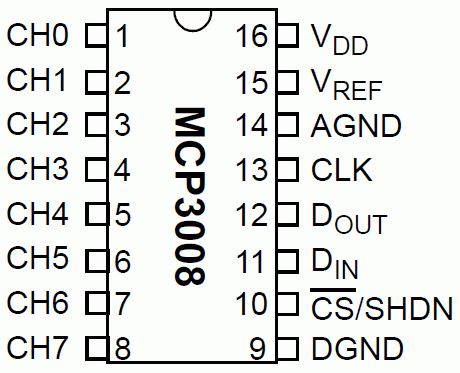
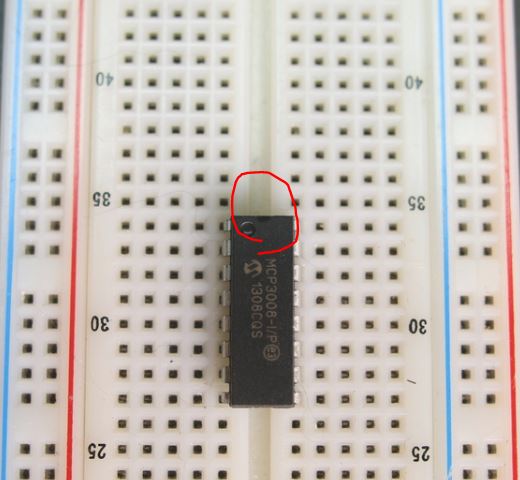
MCP3008 Pin out
The
pin1 of the MCP3008 starts from below the half circle you can see in
the pin out diagram. MCP3008 ADC has a total of 16 pins out of which 8
pins are for taking the analog input. The analog input pins are from
CH0-CH7 (Pins 1-8). On the other side, we have different pins which are
as follows
DGND is digital ground pin for the chip.
CS is the chip select pin.
DIN is the data input pin from the Raspberry Pi.
DOUT is the data output pin.
CLK is the clock pin.
AGND is the analog ground pin.
VREF is the analog reference voltage. Connect to 3.3V. You can change it if you want to change the scale.
VDD is the power pin for the chip.
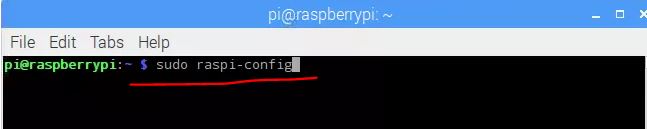
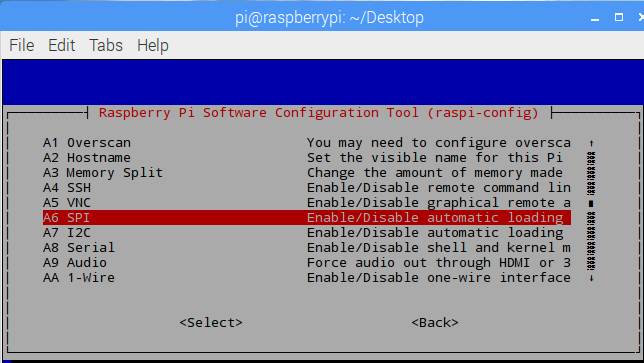
Hardware SPI (the 'spidev' class docs)
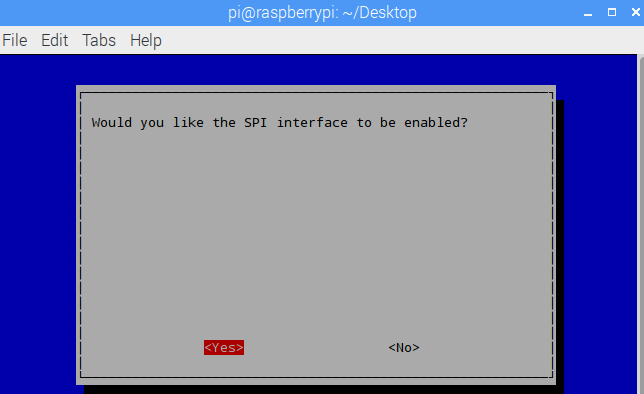
To use hardware SPI first make sure you've enabled SPI using the raspi-config tool.
Be sure to answer yes to both enabling the SPI interface and loading
the SPI kernel module, then reboot the Pi. Check you can see a
/dev/spidev0.0 and /dev/spidev0.1 device when you run the ls -l
/dev/spi* command before continuing. Now wire the MCP3008 to the
Raspberry Pi as follows:
MCP3008 VDD to Raspberry Pi 3.3V
MCP3008 VREF to Raspberry Pi 3.3V
MCP3008 AGND to Raspberry Pi GND
MCP3008 DGND to Raspberry Pi GND
MCP3008 CLK to Raspberry Pi SCLK
MCP3008 DOUT to Raspberry Pi MISO
MCP3008 DIN to Raspberry Pi MOSI
MCP3008 CS/SHDN to Raspberry Pi CE0
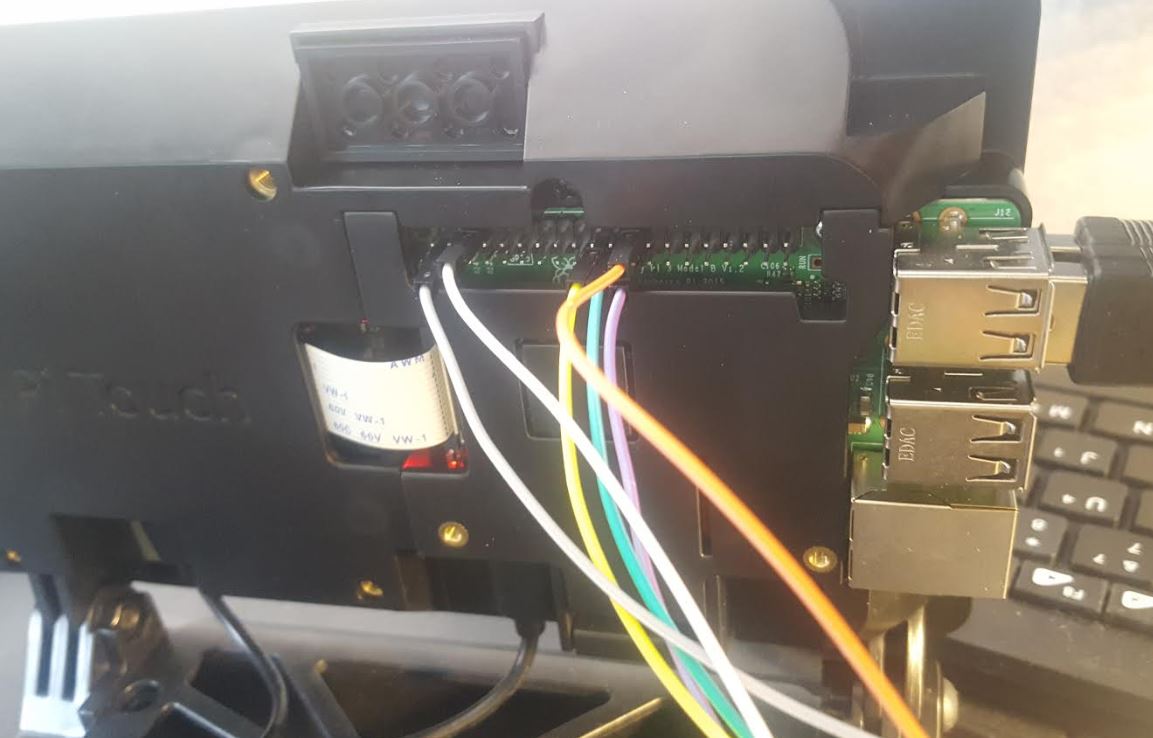
Be careful about the SCLK/MISO/MOSI pins. There are two SPI modules on the RPI board. Use the ones highlighted below:
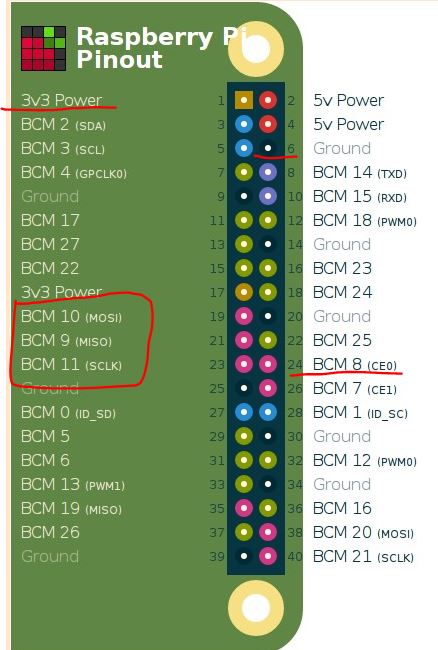
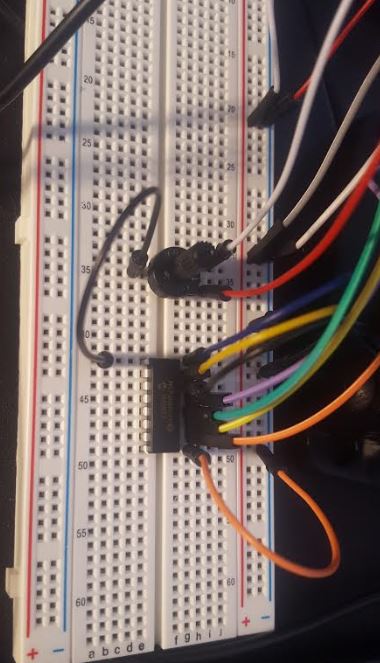
The
MCP3008 connects to the Raspberry Pi using a SPI serial connection. You
can use either the hardware SPI bus, or any four GPIO pins and software
SPI to talk to the MCP3008. This way you can access each of the
legs of the chip from the breadboard. Note that the orientation of the
chip matters! Be sure to place it with the half circle indention and
dot towards the top. See the photo below for an example:
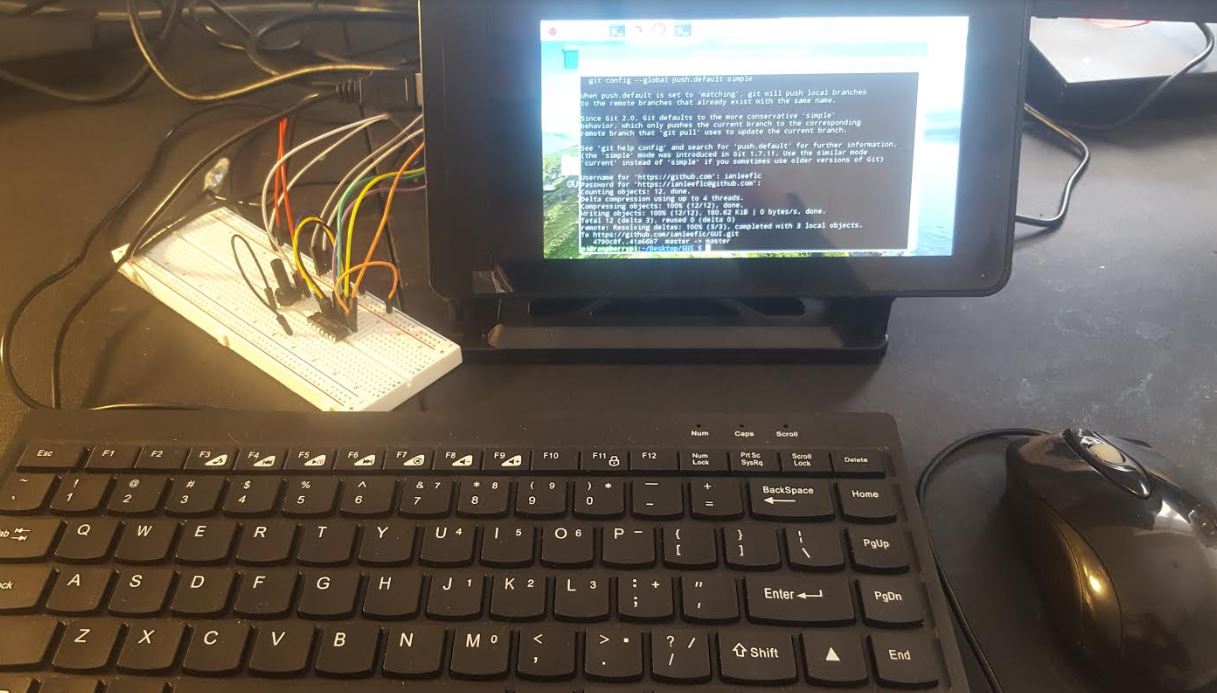
The first acquired SPI data:
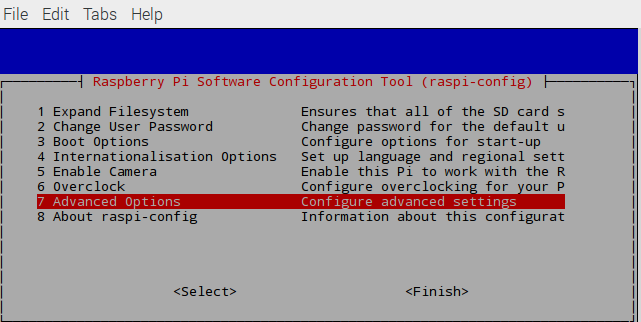
Open the terminal and type the below command:
Then go to the interfacing options.
Connect
the circuit: (Please do not try to copy the connection in the figures
below. Refer to the connection list and the pin map of the RPI in the
beginning of this tutorial section)
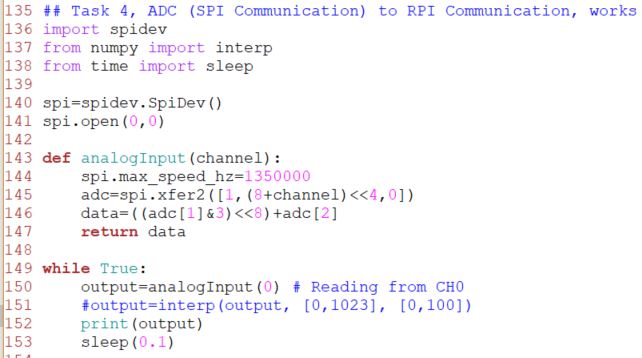
Write the following code into a .py file:
** To understand the SPI communication protocol, you need to understand DIGITAL LOGIC first. It's good we covered this before.
The datasheet for MCP3008. Please make sure you know the following things since they matter:
1) MCP3008 is a 10-bit ADC.
2) RPI is a 16-bit computer.
3)
RPI has one SPI port but two SPI devices, which means the CPU in the
RPI only has one SPI port but they are delivered to two devices. CE0
and CE1 are 'Chip Enable' pins to select which to be used. CE0 selects the uppper one, CE1 selects the lower one.
'spi.open(0,0)' opens port 0 device 0.
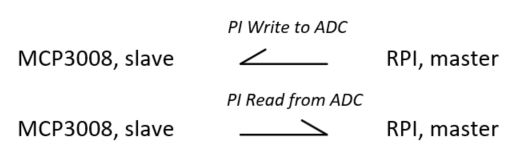
4) RPI is the master, MCP3008 is the slave.
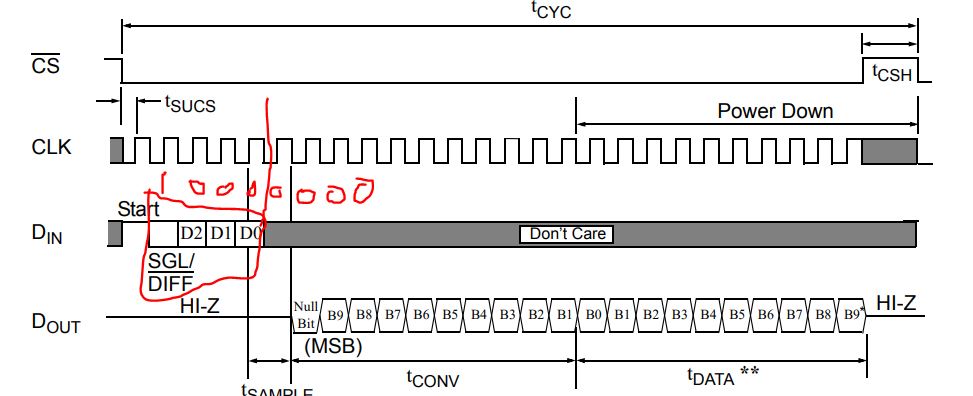
In MCP3008's datasheet, we can found the SPI communication protocol of the MCP3008:
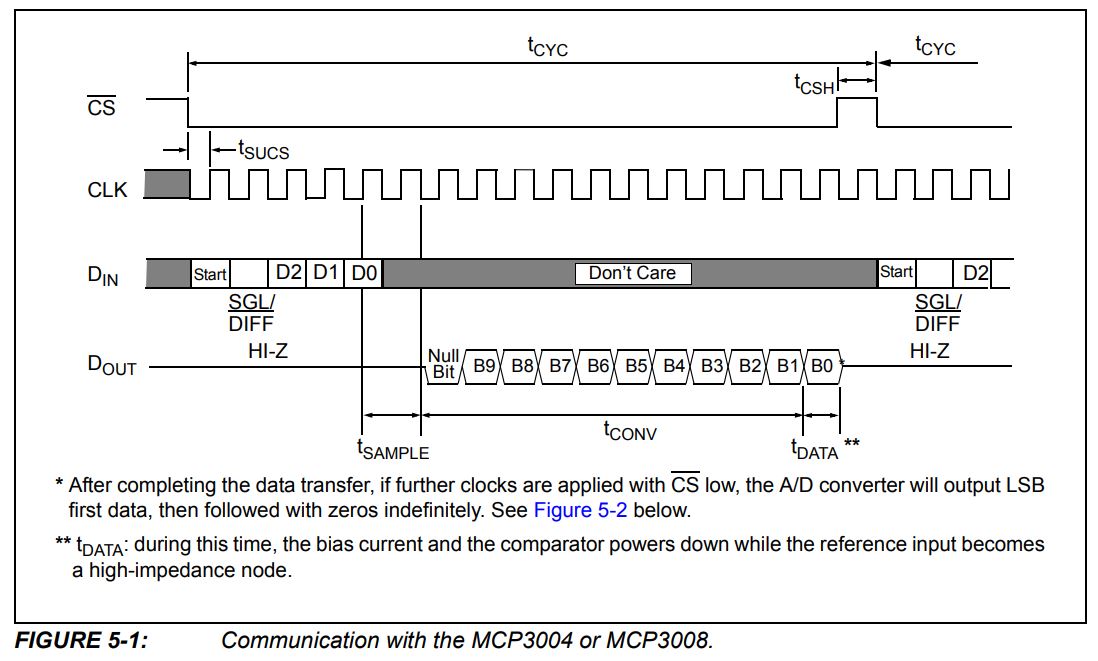
The
communication between PI and MCP are bi-directional. The PI needs to
write to MCP first to set up the configurations, and then read from MCP
to receive the data.
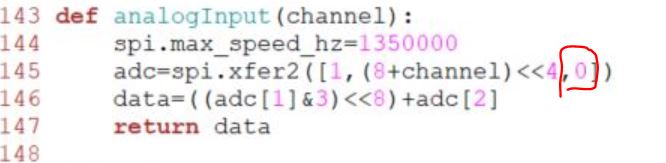
adc = spi.xfer2([1, (8+channel)<<4, 0])
'spi.xfer2()'
will start the conversation. This will send '1 (decimal)' to MCP first.
'1 (decimal)' represents one byte, which is '0000 0001'. The zeros in
the front doesn't matter but the last '1' matters. This '1' will turn
on the Read Mode of MCP. So MCP starts listening. Then send '8+channel'
is actually '0000 1000 + the 3-bit channel address'. The lower 4 bits
will be '1000 + 3-bit address' and then being shifted by 4 bits to the
left to move them to the upper 4 bits.
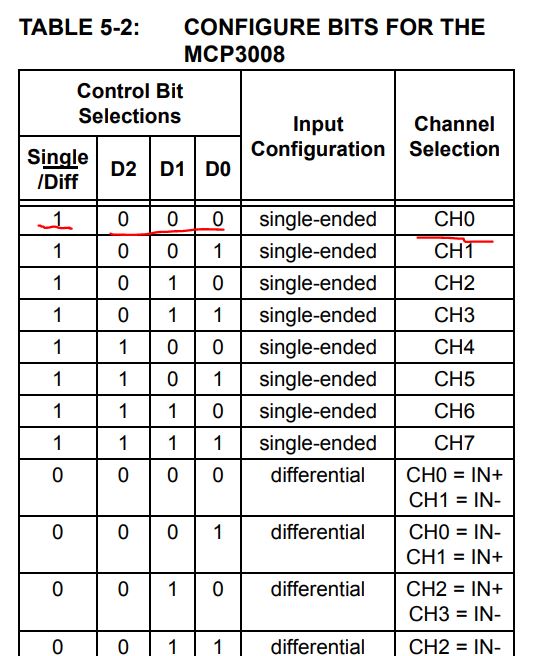
After
the 'shifting', '1000 0000' will be written to MCP and setup 'SGL' and
address D2D1D0 = 000. The lower 4 zeros doesn't matter.
Then, finally, give a '0' to let MCP 'WRITE' to the PI.
After
this configuration, the MCP will start STREAMING the digital data to
the PI from DOUT. The data will be saved in variable 'adc' in the PI's
memory.
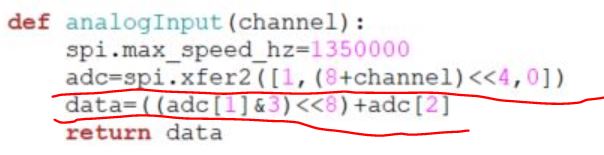
In
variable 'adc', data are being sent in Bytes and stored in the PI in
the form of WORDs, so the first received byte, for example 'xxxx xx01'
should be ANDed to '0000 0000 0000 0011' bit-wisely to only keep the
lower 2 bits which are the real data bits. Then the result should be
shifted by 8 bits to the left to make '0000 0001
0000 0000', and then added to the second received byte to make up this
16-bit data in the PI's memory (only the lower 10 bits are data, all
the rest bits in the memory are zeros).
Finally, 'data' will be the final result.
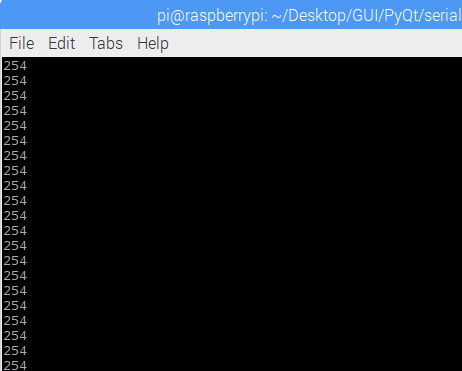
Run this script and if you see the following results then Congratulations!
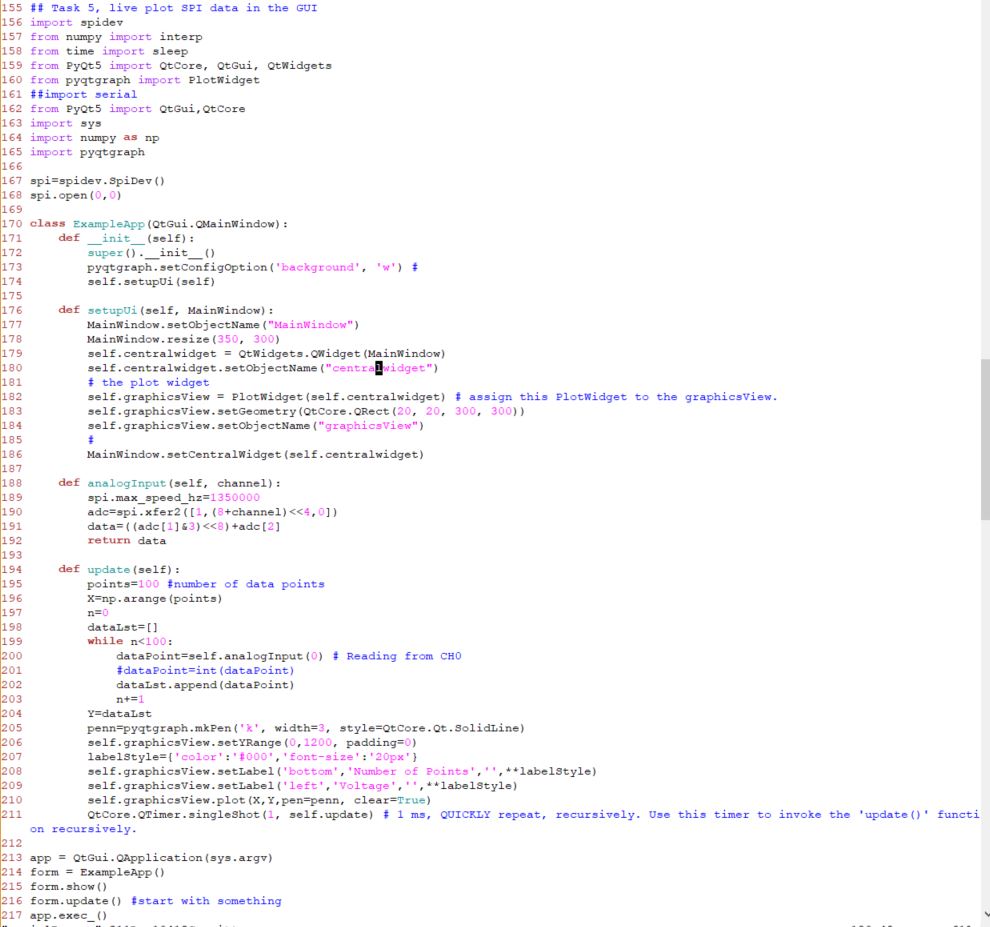
5. Live plot SPI data in the GUI
Now, let's merge this code into the Serial Communication code in Section 3:
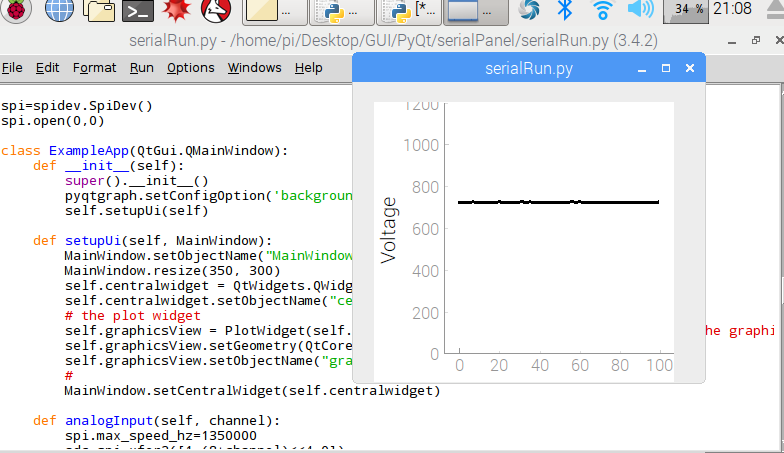
Run
this script, if you see the following GUI with a live plot of the data
from your potentiometer, show it to me and I'll give you the credit for
this section.
Please
not that I didn't polish this GUI. There are many things can be added
to make this little Embedded Data Acquisition System more complete:
1. Add pushbuttons to start/stop the acquisition.
2. Add a menu bar to save the data to a file.
3. Enable a multi-line data live plot in the same window. (different colors for different data lines).
4. Add a title, modify the label and the style of the axis.
5. ..... and many more... until it looks like a commercial product.
As long as the data acquisition is succesful, all other polishments are easy.....
6. Push your updated code on your RPI back to GitHub to update the
repository.
Tasks:
Follow
the tutorial and repeat all the work I've done there. Demonstrate your
work to me in class. Raise your hand when you are done for each task so
I can check these boxes on mygrade
paper.
Section 1: 10 points
Section 2: 10 points
Section 3: 20 points
Section 4: 20 points
Section 5: 30 points
Section 6: 10 points
(There are no due dates for these demonstration tasks here and in the
future.
As long as you can get it done before the final exam, you'll be able to
get the credit for these. You just need to demonstrate it to me in
person).